
Concept explainers
Videos
Quarterly revenue ($ millions) for Twitter for the first quarter of 2012 through the first quarter of 2014 are shown below (adexchange.com, April 2015):
- a. Construct a time series plot. What type of pattern exists in the data?
- b. Using Excel or Minitab, develop a linear trend equation for this time series.
- c. Using Excel or Minitab, develop a
quadratic trend equation for this time series. - d. Compare the MSE for each model. Which model appears better according to MSE?
- e. Use the models developed in parts (b) and (c) to forecast revenue for the tenth quarter.
- f. Which of the two forecasts in part (e) would you use? Explain.
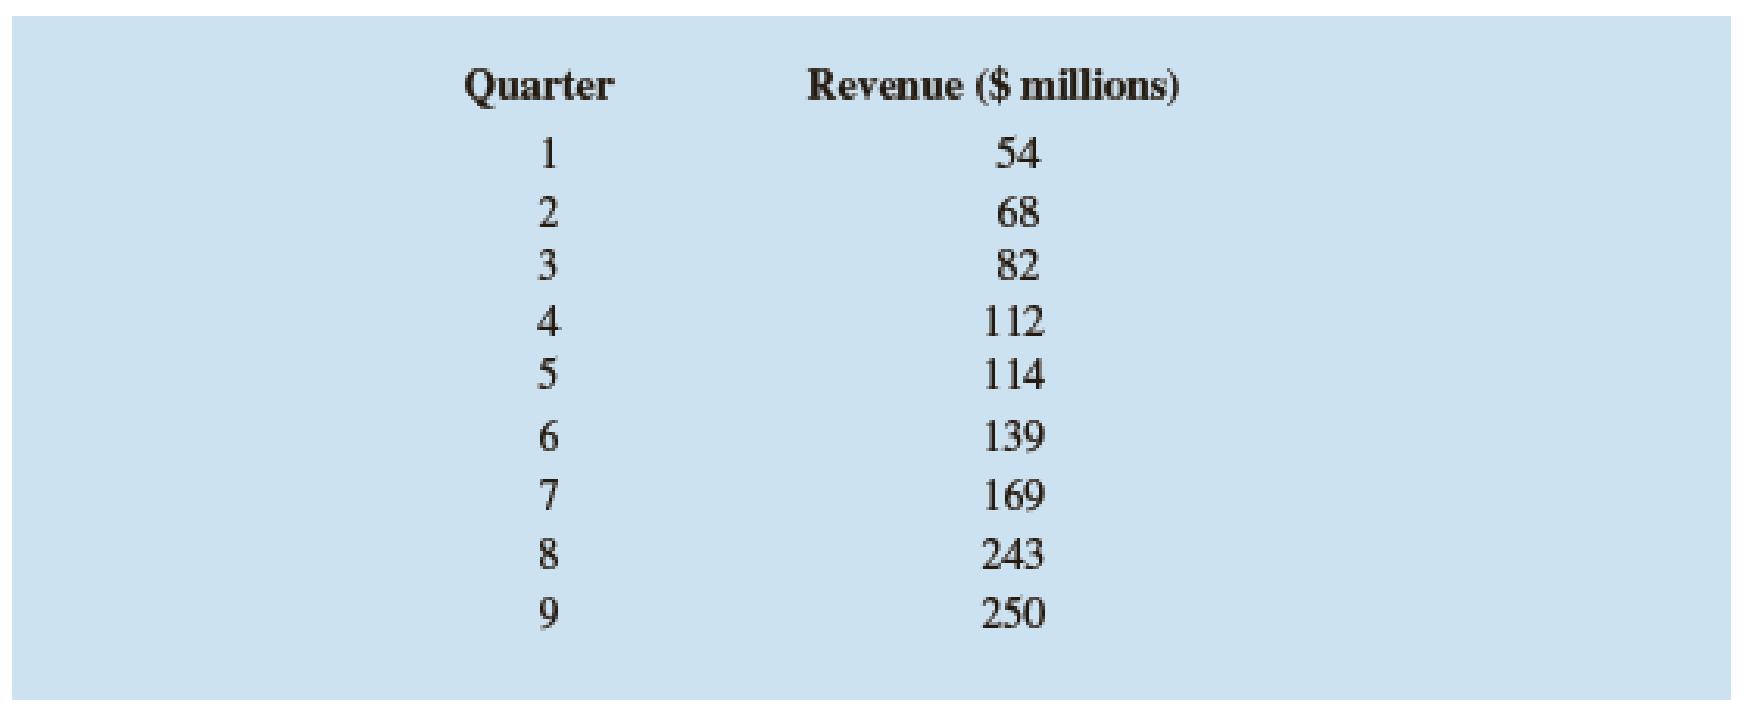
a.
Construct the time series plot.
Explain the type of pattern.
Answer to Problem 25E
The time series plot is given below:
The pattern that appears in the graph is the upward trend.
Explanation of Solution
Calculation:
The given data shows the quarterly revenue for the first quarter of 2012 to the first quarter of 2014.
Software procedure:
Step-by-step software procedure to draw the time series plot using EXCEL:
- Open an EXCEL file.
- In column A, enter the data of Quarter, and in column B, enter the corresponding values of Revenue.
- Select the data that are to be displayed.
- Click on the Insert Tab > select Scatter icon.
- Choose a Scatter with Straight Lines and Markers.
- Click on the chart > select Layout from the Chart Tools.
- Select Chart Title > Above Chart and enter Time Series Plot.
- Select Axis Title > Primary Horizontal Axis Title > Title Below Axis.
- Enter Quarter in the dialog box.
- Select Axis Title > Primary Vertical Axis Title > Rotated Title.
- Enter Revenue in the dialog box.
From the output, the line of graph represents the increase of revenue from year to year.
Thus, the pattern of the graph represents the upward trend.
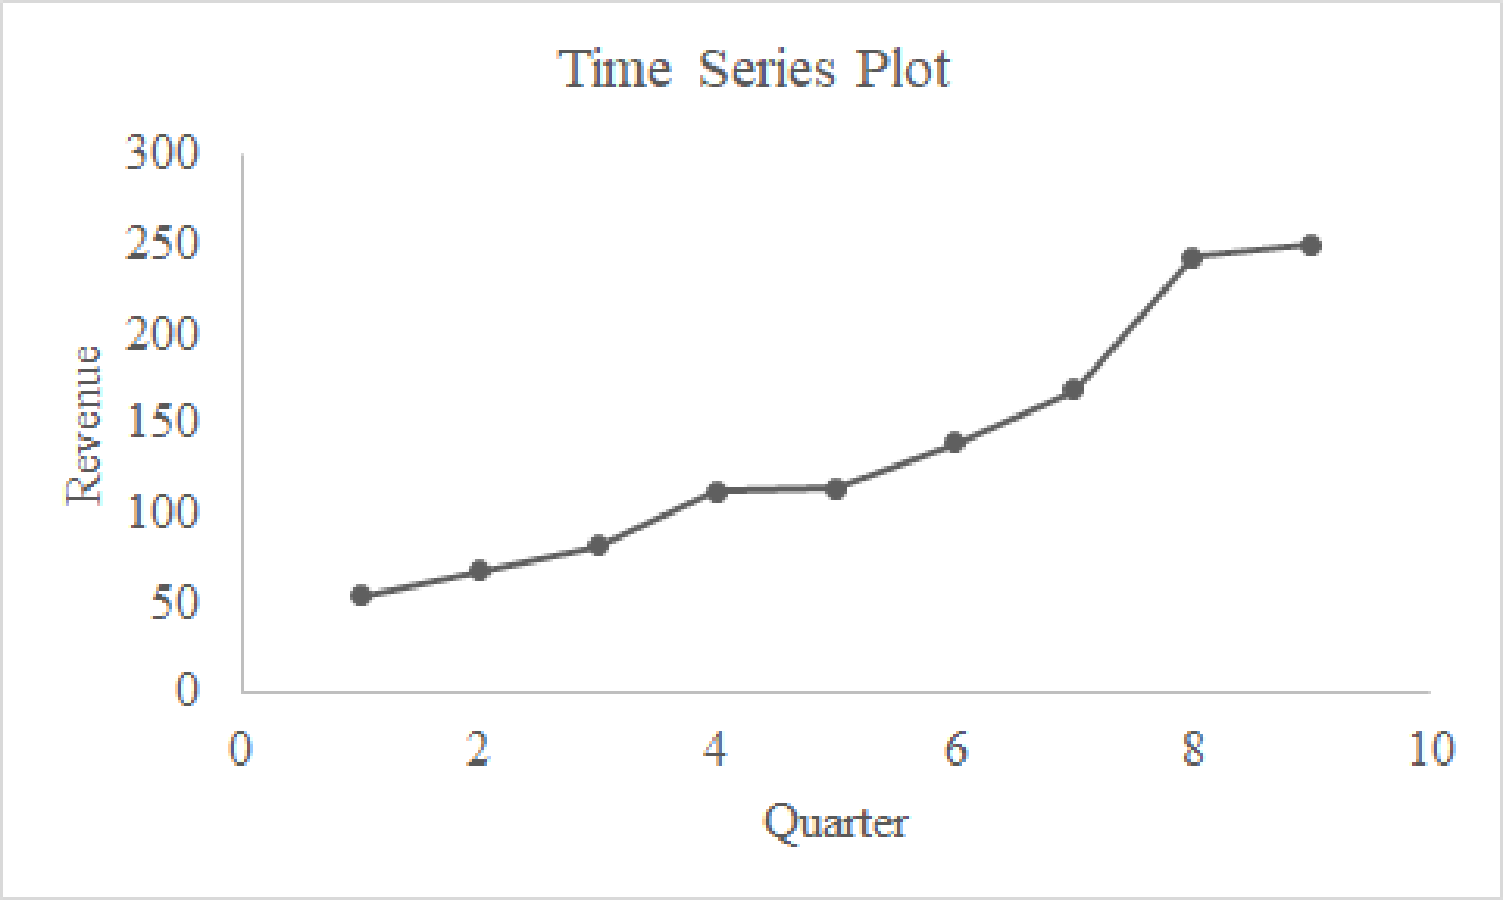
b.
Find the linear trend equation for the data.
Answer to Problem 25E
The linear trend equation is
Explanation of Solution
Calculation:
The linear trend equation is to be obtained.
Software procedure:
Step-by-step software procedure to find the linear trend equation using EXCEL:
- Open an EXCEL file.
- In column A, enter the data of Quarter, and in column B, enter the corresponding values of Revenue.
- Select the data that are to be displayed.
- Click on the Insert Tab > select Scatter icon.
- Choose a Scatter with Straight Lines and Markers.
- Click on the chart > select Layout from the Chart Tools.
- Select Chart Title > Above Chart and enter Time Series Plot.
- Select Axis Title > Primary Horizontal Axis Title > Title Below Axis.
- Enter Quarter in the dialog box.
- Select Axis Title > Primary Vertical Axis Title > Rotated Title.
- Enter Revenue in the dialog box.
- Right Click at any point in the time series plot and select Add Trendline.
- Select Linear under TrendLine Options.
- Choose Display Equation on Chart.
Output using EXCEL is given below:
From the output, the linear trend equation is
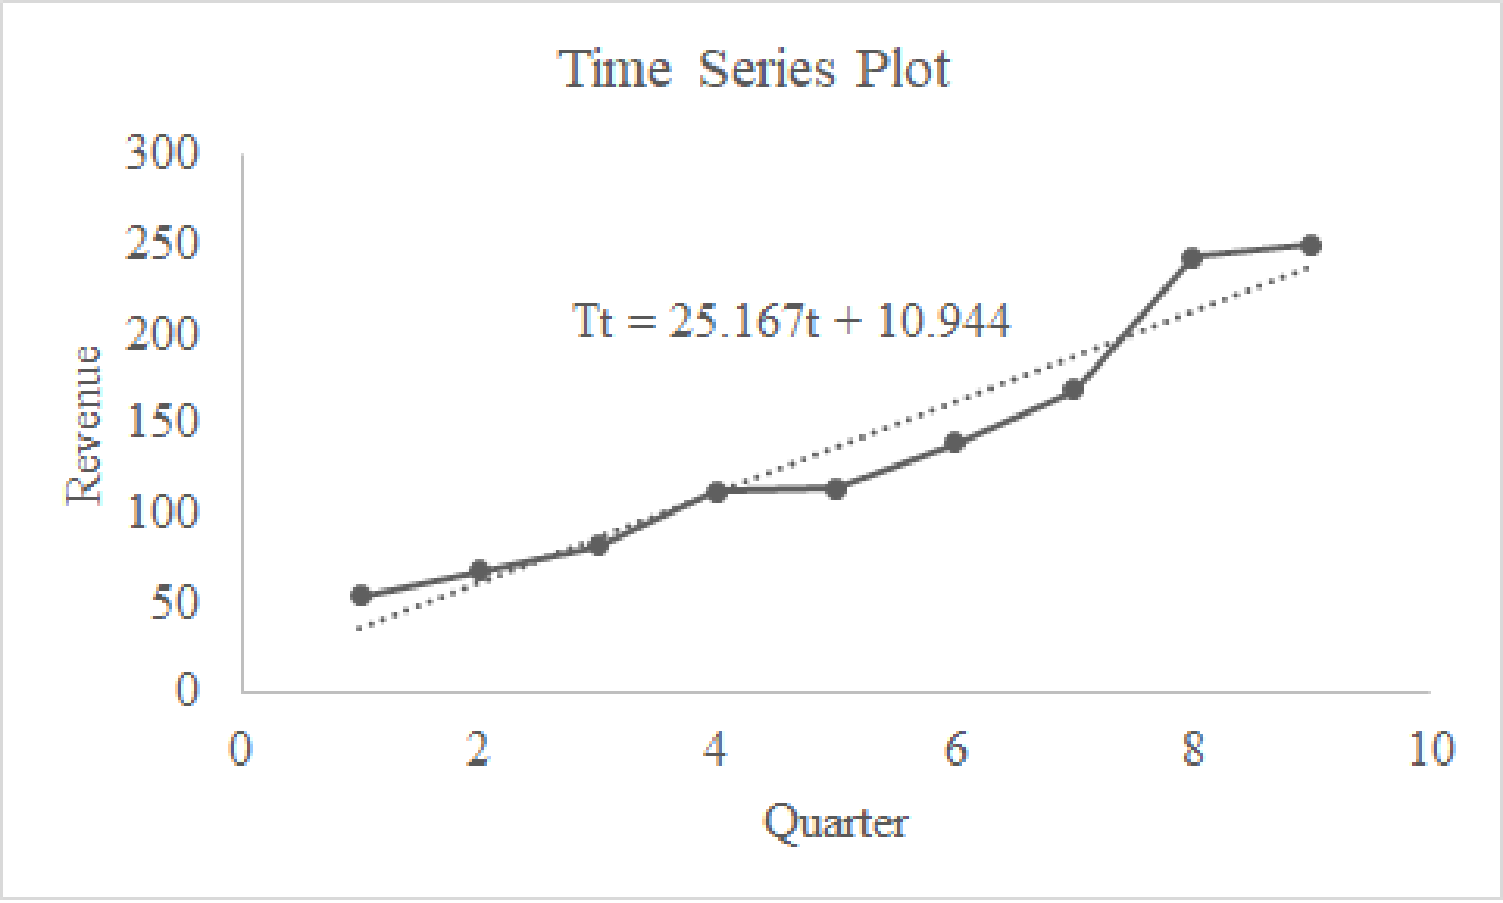
c.
Find the quadratic trend equation for the data.
Answer to Problem 25E
The quadratic trend equation is
Explanation of Solution
Calculation:
The quadratic trend equation is to be obtained.
Software procedure:
Step-by-step software procedure to find the linear trend equation using EXCEL:
- Open an EXCEL file.
- In column A, enter the data of Quarter, and in column B, enter the corresponding values of Revenue.
- Select the data that are to be displayed.
- Click on the Insert Tab > select Scatter icon.
- Choose a Scatter with Straight Lines and Markers.
- Click on the chart > select Layout from the Chart Tools.
- Select Chart Title > Above Chart and enter Time Series Plot.
- Select Axis Title > Primary Horizontal Axis Title > Title Below Axis.
- Enter Quarter in the dialog box.
- Select Axis Title > Primary Vertical Axis Title > Rotated Title.
- Enter Revenue in the dialog box.
- Right Click at any point in the time series plot and select Add Trendline.
- Select Polynomial and enter Order as 2 under TrendLine Options.
- Choose Display Equation on Chart.
Output using EXCEL is given below:
From the output, the quadratic trend equation is
d.
Identify the model that appears better according to MSE.
Answer to Problem 25E
The quadratic model that appears better according to MSE.
Explanation of Solution
Calculation:
The formula for finding mean square error (MSE) is as follows:
For linear trend model:
Software procedure:
Step-by-step procedure to obtain MSE using EXCEL:
- In column A, enter the data of Quarter, and in column B, enter the corresponding values of Revenue.
- In Data, select Data Analysis and choose Regression.
- In Input Y Range, select Revenue.
- In Input X Range, select Quarter.
- Select Labels.
- Click OK.
Output obtained using EXCEL is given below:
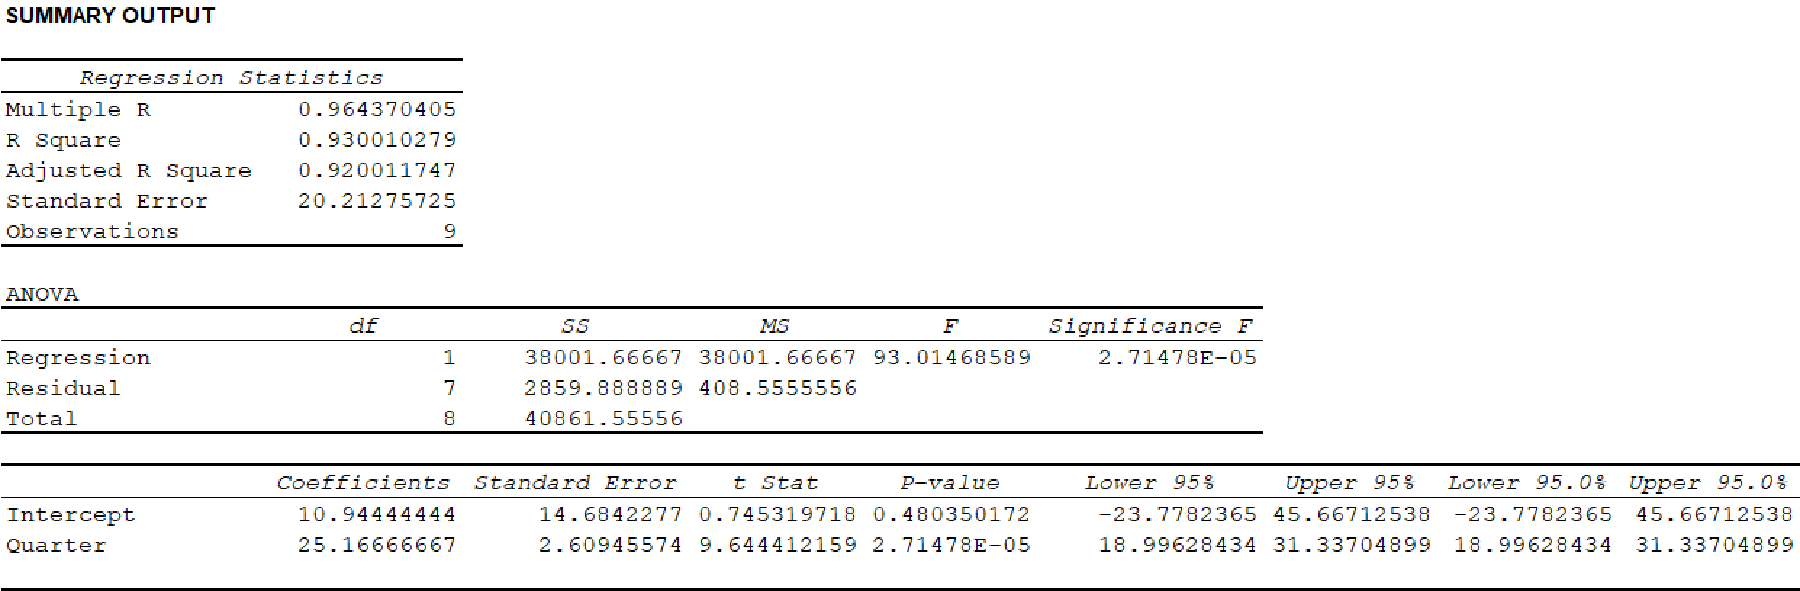
From the output, the MSE is 408.5556.
For Quadratic trend model:
Software procedure:
Step-by-step procedure to obtain MSE using EXCEL:
- In column A, enter the data of Quarter, in column B, enter the data of Quarter Square and in column C, enter the corresponding values of Revenue.
- In Data, select Data Analysis and choose Regression.
- In Input Y Range, select Revenue.
- In Input X Range, select Quarter and Quarter Square.
- Select Labels.
- Click OK.
Output obtained using EXCEL is given below:
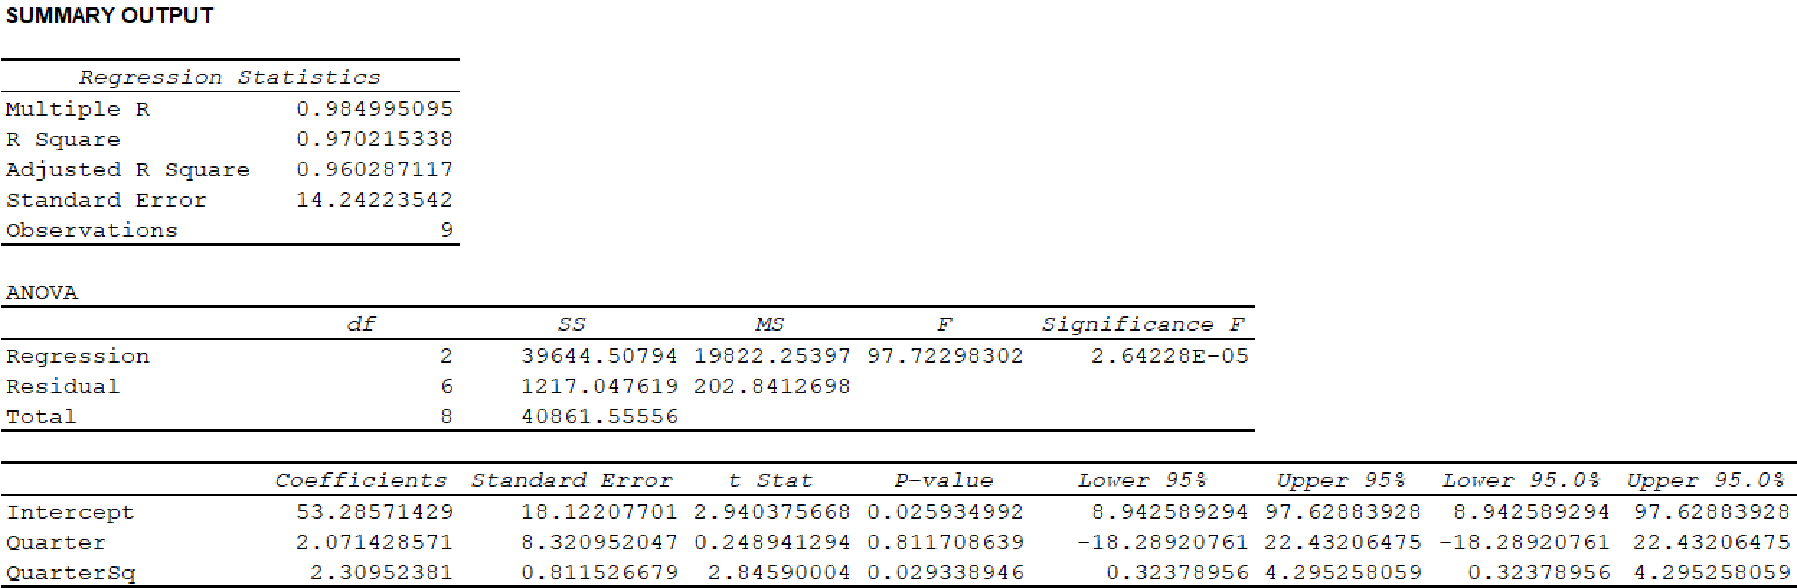
From the output, MSE is 202.8413.
Here, MSE for the quadratic trend equation is less than MSE for the linear trend equation. Hence, the quadratic model provides more accurate forecasts based on MSE.
e.
Find the forecast revenue for the tenth quarter using the models developed in Parts (b) and (c).
Answer to Problem 25E
The forecast revenue for the tenth quarter using the linear model is 262.614.
The forecast revenue for the tenth quarter using the quadratic model is 304.95.
Explanation of Solution
Calculation:
From the results of Part (b), the trend line equation is
The forecast revenue for the tenth quarter using the linear model is obtained as follows:
Thus, the forecast revenue for the tenth quarter using the linear model is 262.614.
From the results of Part (b), the trend line equation is
The forecast revenue for the tenth quarter using the quadratic model is obtained as follows:
Thus, the forecast revenue for the tenth quarter using the linear model is 262.614.
f.
Identify the forecast that is used in Part (e).
Answer to Problem 25E
The forecast revenue for the tenth quarter using the quadratic models is used.
Explanation of Solution
From Part (d), MSE for the quadratic trend equation is less than MSE for the linear trend equation. Hence, the quadratic model provides more accurate forecasts based on MSE. Thus, the forecast revenue for the tenth quarter using the quadratic models is used.
Want to see more full solutions like this?
Chapter 17 Solutions
Mindtapv2.0 For Anderson/sweeney/williams/camm/cochran's Modern Business Statistics With Microsoft Excel, 1 Term Printed Access Card (mindtap Course List)


- Find the mean hourly cost when the cell phone described above is used for 240 minutes.arrow_forwardCryptocurrencies have rapidly become an important alternative to traditional currencies for many types of transactions. Etherium, one of the most prominent cryptocurrencies, has rapidly appreciated in value. Daily Etherium trading information for the first 332 days of 2021. It includes the following variables: Date Day – Day of the year, used to assess trend over time Volume (US $) – Daily trading volume Opening Price (US $) – Opening price for daily trading Price Change (US $) – Daily change in price from opening to close 1. Determine the sample correlation coefficient, r, between Volume and Price Change. Test the alternative hypothesis that Volume has a linear relationship to Price Change. Specifically, what are the test statistic and the p-value for that test statistic? For α = .05, what do you conclude about the relationship between the variables? (reminder: the T.DIST.2T function requires input of a positive test statistic)arrow_forwardA new coronavirus recently triggered a global pandemic. It spreads from 5 cases in March to tens of thousands by May in the Philippines. Case contamination is comparable to what we call exponential spread. Create a table of values representing the covid19 confirmed cases in the Philippines during the first 15 days of March 2020. You can conduct your research online and then plot the results on a Cartesian plane. You can use paper and pencil or any graphing app that is appropriate. Questions to ponder: In order to slow down the growth, what can you do to the curve? In real-life, what must be done to flatten the curve? _________________arrow_forward
- Use a graphing calculator to make a scatter plot of the amounts Leah willaccumulate for years 1 through 5.arrow_forwardThe merchants in Dallas, Texas, suffered flood damage in May 2003. Stores were closed for remodeling nearly two months. What is this type of variation in sales called? Multiple Choice A trend Seasonality A cycle An irreguular componentarrow_forwardEdit Amex PLC has gathered following information on the sales of face mask from April 2020 to September 2020. Month Sales ($) April 17,000 May 18,000 June 19,500 July 22,000 August 21,000 September 23,000 You are required to3; a. Using linear trend equation forecast the sales of face masks for October 2020.arrow_forward
- Using the following time series data of U.S. new car sales ($ millions), respond to the following items. (The data is sourced from https://www.census.gov/retail/index.html#mrts. Find “Monthly Retail Trade Report," then select "Time Series/Trend Charts" to find the data for U.S. new car sales.). $ Sales (Millions) $ 486,565 Year 2009 549,473 608,790 672,550 735,374 785,142 842,120 877,743 911,157 943,538 2010 2011 2012 2013 2014 2015 2016 2017 2018 E Click here for the Excel Data File b. Test for autocorrelation using the 0.05 significance level. (Negative amounts should be indicated by a minus sign. Round your answers to 2 decimal places.) Lagged Residuals Squared Difference Squared Residuals Year Sales Predicted Residuals 2009 $ 486,565 508,123.70 (21,558.70) 0.00 0.00 464,758,328.46 (10,455.50) (2,943.26) 2010 549,473 559,928.50 2011 608,790 611,733.30 2012 672,550 663,538.00 9,011.96 2013 735,374 715,342.80 20,031.19 2014 785.142 767,147.60 17,994.41 2015 842.120 818,952.40…arrow_forwardUse regression analysis to estimate a linear trend line for annual sales.arrow_forwardCreate a 2-D line chart of Cash Sales for months 1-18. Add a trend line with a forward forecast of 3 periods to the chart. Be sure to include the R-squared value on the chart. Using =TREND(), complete the forecast table for months 19-21 1 $ 2,145,600 19 2 $ 2,175,200 20 3 $ 2,255,200 21 4 $ 2,505,600 5 $ 2,748,800 6 $ 2,358,000 7 $ 3,165,200 8 $ 3,253,600 9 $ 3,484,000 10 $ 3,731,200 11 $ 3,741,200 12 $ 3,558,800 13 $ 3,771,200 14 $ 3,787,600 15 $ 3,813,600 16 $ 3,822,800 17 $ 3,828,000 18 $ 3,897,200arrow_forward
- How does one do a trend analysis?arrow_forward67% Outbound travel from China has tripled in the past decade 180 miion 140 100 -https://www.theatlas com/charts/mugEPIL a) What is this title referring to? b) Draw a trendline and create an equation for this data. O According to your model, when will travel double from 2018?arrow_forwardNo need to answer everything! Just plot the actual visitors and the forecasts. Compare the accuracy of the forecasts in the 1985 to 1990 period with those subsequent to that period.arrow_forward
 Glencoe Algebra 1, Student Edition, 9780079039897...AlgebraISBN:9780079039897Author:CarterPublisher:McGraw Hill
 Big Ideas Math A Bridge To Success Algebra 1: Stu...AlgebraISBN:9781680331141Author:HOUGHTON MIFFLIN HARCOURTPublisher:Houghton Mifflin Harcourt
 Trigonometry (MindTap Course List)TrigonometryISBN:9781305652224Author:Charles P. McKeague, Mark D. TurnerPublisher:Cengage Learning
 College Algebra (MindTap Course List)AlgebraISBN:9781305652231Author:R. David Gustafson, Jeff HughesPublisher:Cengage Learning
 Holt Mcdougal Larson Pre-algebra: Student Edition...AlgebraISBN:9780547587776Author:HOLT MCDOUGALPublisher:HOLT MCDOUGAL