Concept explainers
a)
To determine: System utilization rate.
Introduction: Poisson distribution is utilized to ascertain the probability of an occasion happening over a specific time period or interval. The interval can be one of time, zone, volume or separation. The probability of an event happening is discovered utilizing the equation in the Poisson distribution.
a)
Answer to Problem 17P
Explanation of Solution
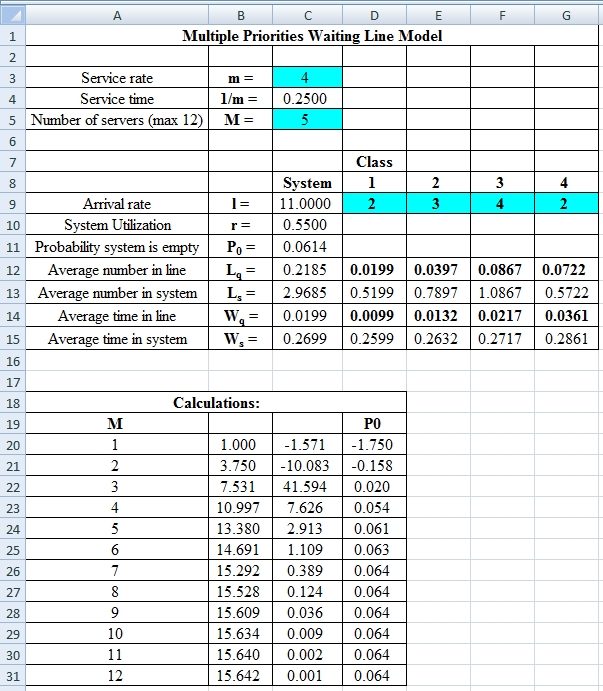
Given Information:
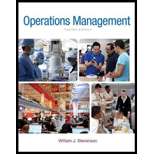
It is given that the processing time is 4 customers per hour and there are 5 servers to process the customers.
| Class | Arrivals per Hour |
| 1 | 2 |
| 2 | 4 |
| 3 | 3 |
| 4 | 2 |
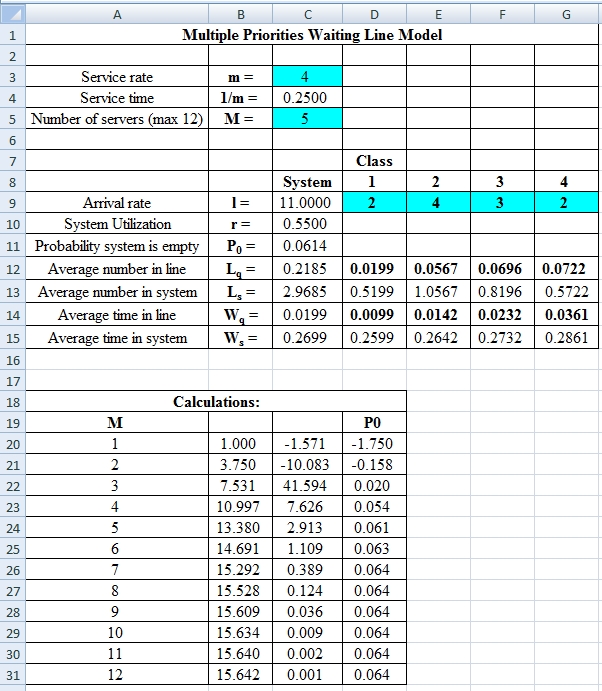
Calculate the system utilization:
It is calculated by adding all the total customer hours for each class and the result is divided with number of servers and customer process per hour.
Here,
M = number of servers
Hence the system utilization is 0.5500.
b)
To determine: The average customer waiting for service for each class and waiting in each class on average.
b)
Answer to Problem 17P
Explanation of Solution
Given Information:
| Class | Arrivals per Hour |
| 1 | 2 |
| 2 | 4 |
| 3 | 3 |
| 4 | 2 |
It is given that the processing time is 4 customers per hour and there are 5 servers to process the customers.
Calculate the average number of customers
It is calculated by dividing the total customers arrive per hour with customer process per hour.
Here,
r = average number of customers
Calculate average number of customers waiting for service (Lq) using infinite-source table values for
The Lq values for
Calculate A using Formula 18-16 from book:
It is calculated by subtracting 1 minus system utilization rate and multiplying the result with Lq, the whole result is divided by total customer arrival rate.
Here,
Lq = average number of customers waiting for service
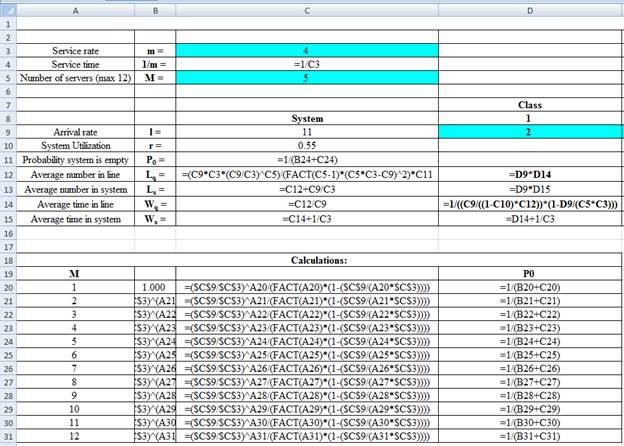
Calculate B using Formula 18-17 from book for each category:
It is calculated by multiplying number of servers with customer service process rate per hour and the result is divided by total customer arrival rate for each category.
Here,
M = number of servers
Calculate the average waiting time for class 1 and class 2
It is calculated by multiplying A with B0 and B1, the result is divided by 1.
Calculate the average number of customers that are waiting for service for class 1 and class 2
It is calculated by multiplying total customer arrival rate with average waiting time for units in each category.
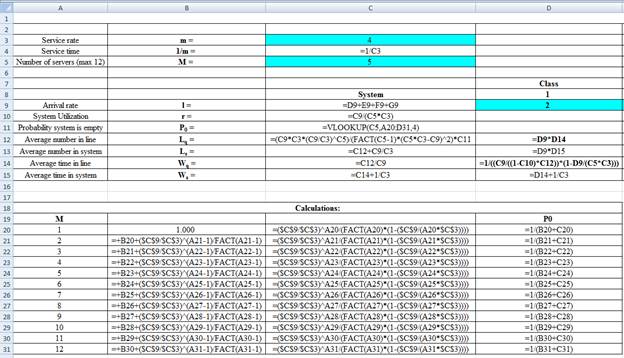
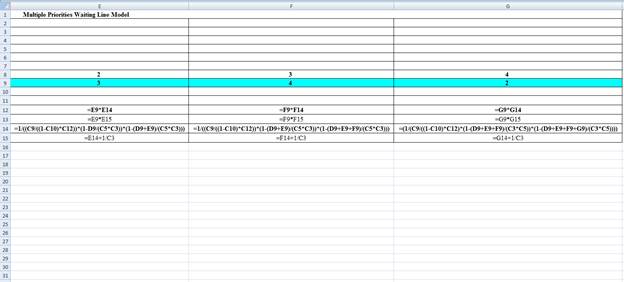
Excel Spreadsheet:
Excel Workings:
Hence the average wait time for service by customers for class 1 is 0.0099 hours, class 2 is 0.0142 hours, class 3 is 0.0232 hours and class 4 is 0.0361 hours. The waiting in each class on average for class 1 is 0.0199 customers, class 2 is 0.0567 customers, class 3 is 0.0696 customers and class 4 is 0.0722 customers.
c)
To determine: The average customer waiting for service for each class and waiting in each class on average.
c)
Answer to Problem 17P
Explanation of Solution
Given Information:
It is given that the processing time is 4 customers per hour and there are 5 servers to process the customers. The second priority class is reduced to 3 units per hour by shifting some into the third party class. The arrival rate is as follows,
| Class | Arrivals per Hour |
| 1 | 2 |
| 2 | 3 |
| 3 | 4 |
| 4 | 2 |
Calculate the average number of customers
It is calculated by dividing the total customers arrive per hour with customer process per hour.
Here,
r = average number of customers
Calculate average number of customers waiting for service (Lq) using infinite-source table values for
The Lq values for
Calculate A using Formula 18-16 from book
It is calculated by subtracting 1 minus system utilization rate and multiplying the result with Lq, the whole result is divided by total customer arrival rate.
Here,
Lq = average number of customers waiting for service
Calculate B using Formula 18-17 from book for each category
It is calculated by multiplying number of servers with customer service process rate per hour and the result is divided by total customer arrival rate for each category.
Here,
M = number of servers
Calculate the average waiting time for class 1 and class 2
It is calculated by multiplying A with B0 and B1, the result is divided by 1.
Calculate the average number of customers that are waiting for service for class 1 and class 2
It is calculated by multiplying total customer arrival rate with average waiting time for units in each category.
Excel Spreadsheet:
Excel Workings:
Hence the average wait time for service by customers for class 1 is 0.0099 hours, class 2 is 0.0132 hours, class 3 is 0.0217 hours and class 4 is 0.0361 hours. The waiting in each class on average for class 1 is 0.0199 customers, class 2 is 0.0397 customers, class 3 is 0.0867 customers and class 4 is 0.0722 customers.
d)
To determine: The observations based on the results from part c.
d)
Answer to Problem 17P
Explanation of Solution
Calculate the change in average wait time for each class.
It is calculated by subtracting the final answer for average wait time for service by customers from part b with the final answer for average wait time for service by customers from part c.
The above results suggest that there is a decrease in average wait time for class 2 and class 3. Class 1 and 4 remains constant.
Calculate the change in average number waiting for each class.
It is calculated by subtracting the final answer for waiting on average from part b with the final answer for waiting on average from part c.
The above results suggest that there is a decrease in average waiting for class 2 and an increase in class 3. Class 1 and 4 remains constant.
Want to see more full solutions like this?
Chapter 18 Solutions
Operations Management (McGraw-Hill Series in Operations and Decision Sciences)


- at the order fulfillment center of a major mail-order firm, customer orders, already packaged for shipment, arrive at the sorting machines to be sorted for loading onto the appropriate truck for the parcel address. the arrival rate at the sorting machines is at the rate of 100 per hour following Poisson distribution. the machine sorts at the constant rate of 150 per hour.a. what is the utilization rate of system? b. what is the average number of packages waiting to be sorted? c. what is the average number of packages in the sorting system? d. how long must the average package wait until it gets sorted? e. what would Lq and wq be if the service rate were exponential, not constant?arrow_forwardCircle Electric Supply is considering opening a second service counter to better serve their electrical contractor customers. The arrival rate is 11 per hour. The service rate is 16 per hour. If the cost of waiting is $31 and the cost of each service counter is $23 per hour, should the second counter be opened? (Give your numerical values in dollars per hour. Round your answers to two decimal places.) With one counter, the cost per hour is $ . With two counters, the cost per hour is $ . The second counter ---Select--- should should not be opened.arrow_forwardConsider a queuing system with a Poisson input and exponential service times. Suppose there is one server and the expected service time is exactly one minute. Compare Ls for the cases where the mean arrival rate is 0.5, 0.9 and 0.99 customers per minute, respectively. Do the same for Lq, Ws, Wq and P(W>5) or the probability of waiting time in the system.arrow_forward
- Dean Smith is dissatisfied with the time it takes to get a new faculty ID made and believes more servers will speed up service and reduce costs thanks to shorter lines. Prof. Karen is tasked to study the situation. Prof. Karen observes an average of 20 customers/hr arriving and each technician (service window) serves 5 customers/hr, on average. There are a total of 4 servers. Assume an M/M/s queue system. Dean Smith suggests that the average time in the QUEUE should be 4 minutes or less. How fast must each service worker work to achieve 4 minutes on average in the Queue? That is, what is the service rate necessary to get to this goal? Please provide an answer to 2 decimal places.arrow_forward. Cranston Cranberry Cooperative (CCC) processes cranberries that are harvested in thelocal area. Barrels of cranberries arrive on trucks to CCC’s facility at a rate of 150barrels per hour and are processed continuously at a rate of 100 barrels per hour.Trucks arrive at a uniform rate over eight hours, from 6:00 a.m. until 2:00 p.m.How long does a truck wait, on average, before it is processed?arrow_forwardA student arrive in a photocopy service. There is only one photocopy operator, and the time required for inquiry varies from student to student. The average arrival rate is 12 students per hour, and the average service rate is 20 students per hour. What is the average service time for this problem? Select one: a. 2.28 minutes b. 4.35 minutes c. 3 minutes d. 1 minutearrow_forward
- The parts department of a large automobile dealership has a counter used exclusively for mechanics’ requests for parts. The time between requests can be modeled by a negative exponential distribution that has a mean of five minutes. A clerk can handle requests at a rate of 15 per hour, andthis can be modeled by a Poisson distribution that has a mean of 15. Suppose there are two clerksat the counter.a. On average, how many mechanics would be at the counter, including those being served?b. What is the probability that a mechanic would have to wait for service?c. If a mechanic has to wait, how long would the average wait be?d. What percentage of time are the clerks idle?e. If clerks represent a cost of $20 per hour and mechanics a cost of $30 per hour, what numberof clerks would be optimal in terms of minimizing total cost?arrow_forwardThe Delacroix Inn in Alexandria is a small exclusive hotelwith 20 rooms. Guests can call housekeeping from 8:00 A.M.to midnight for any of their service needs. Housekeepingkeeps one person on duty during this time to respond to guest calls. Each room averages 0.7 call per day to house-keeping (Poisson distributed), and a guest request requires an average response time of 30 minutes (exponentially dis-tributed) from the staff person. Determine the portion of time the staff person is busy and how long a guest must wait for his or her request to be addressed. Does the house-keeping system seem adequate?arrow_forwardA supermarket manager notices that there are 20 customers at the checkouts andalso knows that arrivals to the checkout at that time of day are at a rate of abouttwo per minute. About how long are customers spending in the checkout process(queueing and being served) on average?arrow_forward
 Practical Management ScienceOperations ManagementISBN:9781337406659Author:WINSTON, Wayne L.Publisher:Cengage,