Concept explainers
a)
1)
To determine: The system utilization rate.
Introduction: System utilization refers to percentage amount of capacity which is utilized or we can say that actual output is divided by potential output. It is operational metric for business which indicates aggregate productive capacity.
It reflects the ratio of demand to capacity or supply, it is also commonly known as Capacity utilization rate.
a)
1)
Answer to Problem 1P
Explanation of Solution
Given information:
Formula,
Where,
System utilization rate denoted by
Demand rate (measured as arrival) denoted by
Supply rate (measured as service) denoted by
Calculation of the system utilization:
Therefore, system utilization rate is 0.6000.
1)
To determine: The system utilization rate.
Introduction: System utilization refers to percentage amount of capacity which is utilized or we can say that actual output is divided by potential output. It is operational metric for business which indicates aggregate productive capacity.
It reflects the ratio of demand to capacity or supply, it is also commonly known as Capacity utilization rate.
1)
Answer to Problem 1P
Explanation of Solution
Given information:
Formula,
Where,
System utilization rate denoted by
Demand rate (measured as arrival) denoted by
Supply rate (measured as service) denoted by
Calculation of the system utilization:
Therefore, system utilization rate is 0.6000.
2)
To determine: The average number customers waiting for service in line.
2)
Answer to Problem 1P
Explanation of Solution
Explanation
Given information:
Formula as per single server model of average number customers waiting for service in line
Where,
Demand rate (measured as arrival) denoted by
Supply rate per server denoted by
Calculation of Average number of customers waiting in line (Lq):
Therefore, average number of customers waiting in line (Lq) is 0.9000.
3)
To determine: Average number of customers waiting time.
3)
Answer to Problem 1P
Explanation of Solution
Given information:
Formula as per single server model of average number customers waiting for service in line:
Where,
Demand rate (measured as arrival) denoted by
Calculation of Average number of customers waiting in line (
Therefore, average number customers waiting time (
b)
1)
To determine: The average number of customer waiting for repairs.
b)
1)
Answer to Problem 1P
Explanation of Solution
Given information:
Mean service time: 2 hours
M =1
Calculation of
Formula as per single server model of average number customers waiting for service in line:
Where,
Demand rate (measured as arrival) denoted by
Supply rate per server denoted by
Calculation of Average number of customers waiting in line (Lq):
Therefore, Average number of customers waiting in line (Lq) is 2.250.
1)
To determine: The average number of customer waiting for repairs.
1)
Answer to Problem 1P
Explanation of Solution
Given information:
Mean service time: 2 hours
M =1
Calculation of
Formula as per single server model of average number customers waiting for service in line:
Where,
Demand rate (measured as arrival) denoted by
Supply rate per server denoted by
Calculation of Average number of customers waiting in line (Lq):
Therefore, Average number of customers waiting in line (Lq) is 2.250.
2)
To determine: The system utilization rate.
Introduction: It reflects the ratio of demand to capacity or supply, it is also commonly known as Capacity utilization rate.
2)
Answer to Problem 1P
Explanation of Solution
Given information:
Formula,
Where,
System utilization rate denoted by
Demand rate (measured as arrival) denoted by
Supply rate (measured as service) denoted by
Calculation of the system utilization:
Therefore, system utilization rate is 0.750.
3)
To determine: The idle time.
3)
Answer to Problem 1P
Explanation of Solution
Calculation of the idle time:
Therefore, idle time per day per hours is 2hours per day.
4)
To determine: Probability of two or more customers in the system.
4)
Answer to Problem 1P
Explanation of Solution
Step 1: Calculate the probability of less than two:
Therefore, probability of less than two is 0.4375.
Step 2: Calculation probability of two or more than customer in the system:
Therefore, probability of less than two is 0.5625.
c)
1)
To determine: The system utilization rate.
c)
1)
Answer to Problem 1P
Explanation of Solution
Given information
Formula:
Where,
System utilization rate denoted by
Demand rate (measured as arrival) denoted by
Supply rate (measured as service) denoted by
Calculation of the system utilization:
Therefore, system utilization rate is 0.7500.
1)
To determine: The system utilization rate.
1)
Answer to Problem 1P
Explanation of Solution
Given information
Formula:
Where,
System utilization rate denoted by
Demand rate (measured as arrival) denoted by
Supply rate (measured as service) denoted by
Calculation of the system utilization:
Therefore, system utilization rate is 0.7500.
2)
To determine: Average number of customers in the system (Ls).
2)
Answer to Problem 1P
Explanation of Solution
Step 1: Calculation of the average number of customer served
Therefore average number of customer served is 1.5.
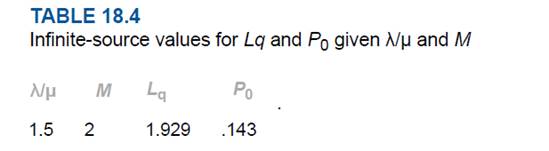
Step 2: find the value of
Given information:
Then, from Infinite-source values table we find that value for
For reference:
Step 3: Calculation of the average number of customers in the system (Ls)
Therefore, the average number of customers in the system (Ls) is 3.429.
3)
To determine: Average time customers wait in line for service (Wq).
3)
Answer to Problem 1P
Explanation of Solution
Therefore, the average time customers wait in line for service (Wq).is 0.107.
4)
To determine: The average waiting time for an arrival not immediately served (hours) (Wa).
4)
Answer to Problem 1P
Explanation of Solution
Calculation of average waiting time for an arrival not immediately served (hours) (Wa):
Therefore, average waiting time for an arrival not immediately served (hours) (Wa) is 0.167 hours.
Want to see more full solutions like this?
Chapter 18 Solutions
Operations Management (McGraw-Hill Series in Operations and Decision Sciences)


- In a waiting line situation, arrivals occur at a rate of 2 per minute, and the service times average 18 seconds. Assume the Poisson and exponential distributions. a. What is λ? b. What is μ? c. Find probability of no units in the system. d. Find average number of units in the system. e. Find average time in the waiting line. f. Find average time in the system. g. Find probability that there is one person waiting. h. Find probability an arrival will have to wait. Please show a corrct solution and answer. Thank you.arrow_forwardAn airline is planning to open a satellite ticket desk in a new shopping plaza, staffed byone ticket agent. It is estimated that requests for tickets and information will average15 per hour and requests will have a Poisson distribution. Service time is assumed to be exponentially distributed. Previous experience with similar satellite operations suggeststhat mean service time should average about three minutes per request. Determine each ofthe following:a. System utilizationb. Percentage of time the server (agent) will be idlec. The expected number of customers waiting to be servedd. The average time customers will spend in the systeme. The probability of zero customers in the system and the probability of four customersin the system.arrow_forwardA server operates with 75 percent utilization. The average processing time istwo minutes and the standard deviation of processing time is one minute. The coefficient ofvariation of the arrival process is one. What is the average time in the queue for customers?arrow_forward
- A server operates with 90 % utilization. Coefficient of variation of service process is 0.6. Coefficient of variation of arrival process is 0.8. Average processing time is 4 minutes. What is the average time a customer spends in the system using the single server queuing model ? Show all formulas used, calculations and results.arrow_forwardA small town with one hospital has two ambulances to supply ambulance service. Requests forambulances during non-holiday weekends average .45 per hour and tend to be Poisson-distributed.Travel and assistance time averages two hours per call and follows an exponential distribution.Find:a. System utilizationb. The average number of customers waitingc. The average time customers wait for an ambulanced. The probability that both ambulances will be busy when a call comes inarrow_forwardWhat is the theoretical distribution which describes the service time in queuing theory? A. Negative exponential B. Six sigma limits C. Bell curve D. Poissonarrow_forward
 Practical Management ScienceOperations ManagementISBN:9781337406659Author:WINSTON, Wayne L.Publisher:Cengage,