Concept explainers
a.
To calculate: The amount of FCFE per share for the year 2016 using the data given in the table.
Introduction:
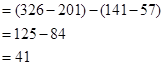
FCFE: When expanded, it is
a.
Answer to Problem 3CP
The free cash flow earning(FCFE) per share will be
Explanation of Solution
The information given to us is as follows:
Table 18A
Sundanci actual 2010 and 2011 financial statements
for fiscal years ending May 31
(Amount in million $, except per share data)
| Income statement | 2010 | 2011 |
| Revenue |  |  |
 | 23 | |
| Other operating costs |  |  |
| Income before taxes |  |  |
| Taxes |  |  |
| Net Income |  |  |
| Dividends |  |  |
| Earnings per share |  |  |
| Dividend per share |  |  |
| Common shares outstanding (millions) |  |  |
| Balance sheet | 2010 | 2011 |
| Current assets |  |  |
| Net property, plant and equipment |  |  |
| Total assets |  |  |
| Current liabilities |  |  |
| Long term debt | 0 | 0 |
| Total liabilities |  |  |
| Shareholder’s equity |  |  |
| Total liabilities and equity |  |  |
| Capital expenditures |  |  |
Sundanci FCFE will grow at  for two year and
  thereafter.
Capital expenditures, depreciation and working capital are expected to increase proportionately with FCFE.
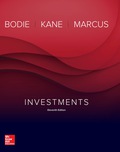
Note 1: Calculation of increase in working capital:

Therefore, when there is an increase in working capital, it implies that the there is an increase in current assets and current liabilities.
Let us now calculate the increase in working capital.

The value of currents assets has increased from Similarly, even the current liabilities have increased from
  million dollars. So, let us consider the difference amounts for calculations.
Therefore the net increase in working capital will be
Calculation of FCFE per share:
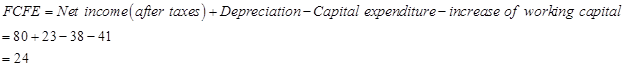 Number of outstanding shares=84 (as per the given information.)
or 0.286 when rounded off.
Therefore, free cash flow equity per share will be
b.
To calculate: The current value of a share of Sundanci stock using the two-stage FCFE model.
Introduction:
DDM model: DDM model refers to
b.
Answer to Problem 3CP
The current value of the share is
Explanation of Solution
The information given to us is as follows:
Table 18A
Sundanci actual 2010 and 2011 financial statements
for fiscal years ending May 31
(Amount in million $, except per share data)
| Income statement | 2010 | 2011 |
| Revenue |  |  |
| Depreciation |  |  |
| Other operating costs |  |  |
| Income before taxes |  |  |
| Taxes |  |  |
| Net Income |  |  |
| Dividends |  |  |
| Earnings per share |  |  |
| Dividend per share |  |  |
| Common shares outstanding (millions) |  |  |
| Balance sheet | 2010 | 2011 |
| Current assets |  |  |
| Net property, plant and equipment | 474 | 489 |
| Total assets | 675 | 815 |
| Current liabilities | 57 | 141 |
| Long term debt | 0 | 0 |
| Total liabilities | 57 | 141 |
| Shareholder’s equity | 618 | 674 |
| Total liabilities and equity | 675 | 815 |
| Capital expenditures | 34 | 38 |
Sundanci FCFE will grow at 27% for two year and 13% thereafter.
Capital expenditures, depreciation and working capital are expected to increase proportionately with FCFE.
Usage of two-stage FCFE model is simple. We have to first calculate the FCFE per share in the year 2012 and 2013. We have to proceed with calculation using the given information that there is a growth rate of 27%. Then, we have to calculate the terminal value in 2013 which has a continuous growth of 13%. Finally, this value has to be discounted at current period by the required
Let us now calculate the current value of a share.
| Income statement | Actual | Estimated | |||
| 2011 | 2012 | 2013 | 2014 | ||
| Growth
rate | 27%- | 27% | 13% | ||
| Per share value | Per share value | Per share value | |||
| Net
Income | 80 |  |  |  |  |
| Add: Depreciation | 23 |  |  |  | 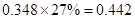 |
| Less:
Capital expenditure | -38 |  | 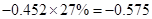 | 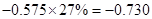 | 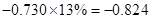 |
| Less: Increase in working capital | -41 |  |  |  |  |
| FCFE | 24 |  |  | 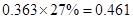 | 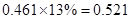 |
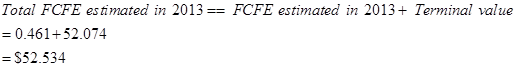
Let us now calculate the terminal value.

The rate of return 14% and perpetuity dividends 13% are converted into decimals by dividing it by 100.

Having done, let us now calculate the total FCFE estimated in 2013.
Let us now discount the FCFE to derive the FCFE per share value.
Since, we are given that the required rate of return is 14%, let us use the PV factor of 14% 
So, when we are calculating the PV factor for 2012, it will be 1.
For 2013 PV factor= 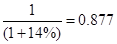
For 2014 PV factor= 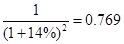
So, now we have to calculate the discounted value.

For 2013 Discounted value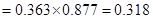
For 2014 discounted value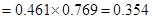
Therefore, the current value of the share=40.742.
c.
To describe: The limitation of two-state DDM model calculated by using and than by not using the two-stage FCFE model.
Introduction:
DDM Model: DDM model refers to dividend discount model. It is supposed to be a quantitative method useful in estimating the company’s stock price.
c.
Answer to Problem 3CP
The assumption of continuous growth sounds unrealistic resulting in a number of limitations on usage.
Explanation of Solution
The whole concept of DDM is based on the theory that the present- day’s price is worth the sum of all of its future dividend payments which are later discounted back to is present value.
- The shares of a company cannot be valued using DDM model since distribution of dividends is not possible. With the help of FCFE model, the value of the firm can be predicted even though dividends are not distributed.
- When both models i.e., FCFE model and DDM, we can observe one thing. The assumption of continuous growth rate sounds unrealistic. Practically seen, the growth rate keeps on changing and it is highly impossible for it to be stable for a long time. Estimation of the time when the growth rate will be constant is not possible. This results in difficulty in calculation of required rate of return.
Want to see more full solutions like this?
Chapter 18 Solutions
EBK INVESTMENTS


- As a first step, we need to estimate what percentage of MMMs capital comes from debt, preferred stock, and common equity. This information can be found on the firms latest annual balance sheet. (As of year end 2014, MMM had no preferred stock.) Total debt includes all interest-bearing debt and is the sum of short-term debt and long-term debt. a. Recall that the weights used in the WACC are based on the companys target capital structure. If we assume that the company wants to maintain the same mix of capital that it currently has on its balance sheet, what weights should you use to estimate the WACC for MMM? b. Find MMMs market capitalization, which is the market value of its common equity. Using the sum of its short-term debt and long-term debt from the balance sheet (we assume that the market value of its debt equals its book value) and its market capitalization, recalculate the firms debt and common equity weights to be used in the WACC equation. These weights are approximations of market-value weights. Be sure not to include accruals in the debt calculation.arrow_forwardShoobee, Inc. has asked its financial manager to measure the cost of each specific type of capital as well as the weighted average of capital. The WACC it to be measured by using the following weights: 50% long term, 10% preferred stock, and 40% common stock equity (retained earnings, new common stock issuance, or both). The firm tax is 25%. Debt: The firm can sell for P980, a 10-year, P1,000 par value bond paying annual interest at 13% coupon rate. A flotation cost of 3% of the par value is required in addition to the discount of P20 per bond. Preferred stock: 8 percent (annual dividend) preferred stock having a par value of P100 can be sold for P65. An additional fee of P2.00 per share must be paid to the underwriters. Common stock: The firm’s common stock is currently selling for P50 per share. The recent dividend paid was P4.00 per share. Its dividend payments which have approximately 60% of earnings per share in each past 6 years follows: Year Dividend 2021 P4.00 2020 3.75…arrow_forwardDillon Labs has asked its financial manager to measure the cost of each specific type of capital as well as the weighted average cost of capital. The weighted average cost is to be measured by using the following weights: 30% long-term debt, 10% preferred stock, and 60% common stock equity (retained earnings, new common�� stock, or both). The firm's tax rate is 23%. Debt : The firm can sell for $1030 a 14-year, $1,000-par-value bond paying annual interest at a 8.00% coupon rate. A flotation cost of 2% of the par value is required. Preferred stock: 9.00% (annual dividend) preferred stock having a par value of $100 can be sold for $92.An additional fee of $2 per share must be paid to the underwriters. Common stock: The firm's common stock is currently selling for $90 per share. The stock has paid a dividend that has gradually increased for many years, rising from $2.00 ten years ago to the $3.26 dividend payment, D0, that the company just recently made.…arrow_forward
- Dillon Labs has asked its financial manager to measure the cost of each specific type of capital as well as the weighted average cost of capital. The weighted average cost is to be measured by using the following weights: 30% long-term debt, 10% preferred stock, and 60% common stock equity (retained earnings, new common stock, or both). The firm's tax rate is 23%. Debt : The firm can sell for $1030 a 14-year, $1,000-par-value bond paying annual interest at a 8.00% coupon rate. A flotation cost of 2% of the par value is required. Preferred stock: 9.00% (annual dividend) preferred stock having a par value of $100 can be sold for $92.An additional fee of $2 per share must be paid to the underwriters. Common stock: The firm's common stock is currently selling for $90 per share. The stock has paid a dividend that has gradually increased for many years, rising from $2.00 ten years ago to the $3.26 dividend payment, D0, that the company just recently made.…arrow_forwardDillon Labs has asked its financial manager to measure the cost of each specific type of capital as well as the weighted average cost of capital. The weighted average cost is to be measured by using the following weights: 40% long-term debt, 15% preferred stock, and 45% common stock equity (retained earnings, new common stock, or both). The firm's tax rate is 26%. Debt The firm can sell for $1005 a 13-year, $1,000-par-value bond paying annual interest at a 6.00% coupon rate. A flotation cost of 2.5% of the par value is required. Preferred stock 7.00% (annual dividend) preferred stock having a par value of $100 can be sold for $98. An additional fee of $5 per share must be paid to the underwriters. Common stock The firm's common stock is currently selling for $80 per share. The stock has paid a dividend that has gradually increased for many years, rising from $2.50 ten years ago to the $4.92 dividend payment, D0, that the company just recently made. If…arrow_forwardDillon Labs has asked its financial manager to measure the cost of each specific type of capital as well as the weighted average cost of capital. The weighted average cost is to be measured by using the following weights: 40% long-term debt, 15% preferred stock, and 45% common stock equity (retained earnings, new common stock, or both). The firm's tax rate is 26%. Debt The firm can sell for $1005 a 13-year, $1,000-par-value bond paying annual interest at a 6.00% coupon rate. A flotation cost of 2.5% of the par value is required. Preferred stock 7.00% (annual dividend) preferred stock having a par value of $100 can be sold for $98. An additional fee of $5 per share must be paid to the underwriters. Common stock The firm's common stock is currently selling for $80 per share. The stock has paid a dividend that has gradually increased for many years, rising from $2.50 ten years ago to the $4.92 dividend payment, D0, that the company just recently made. If…arrow_forward
- Dillon Labs has asked its financial manager to measure the cost of each specific type of capital as well as the weighted average cost of capital. The weighted average cost is to be measured by using the following weights: 35% long-term debt, 20% preferred stock, and 45% common stock equity (retained earnings, new common stock, or both). The firm's tax rate is 21%. Debt The firm can sell for $1030 a 13-year, $1,000-par-value bond paying annual interest at a 7.00% coupon rate. A flotation cost of 2% of the par value is required. Preferred stock 8.5% (annual dividend) preferred stock having a par value of $100 can be sold for $90. An additional fee of $4 per share must be paid to the underwriters. Common stock The firm's common stock is currently selling for $60 per share. The stock has paid a dividend that has gradually increased for many years, rising from $2.75 ten years ago to the $5.41 dividend payment, D0, that the company just recently made. If the…arrow_forwardDillon Labs has asked its financial manager to measure the cost of each specific type of capital as well as the weighted average cost of capital. The weighted average cost is to be measured by using the following weights: 35% long-term debt, 20% preferred stock, and 45% common stock equity (retained earnings, new common stock, or both). The firm's tax rate is 21%. Debt The firm can sell for $1030 a 13-year, $1,000-par-value bond paying annual interest at a 7.00% coupon rate. A flotation cost of 2% of the par value is required. Preferred stock 8.5% (annual dividend) preferred stock having a par value of $100 can be sold for $90. An additional fee of $4 per share must be paid to the underwriters. Common stock The firm's common stock is currently selling for $60 per share. The stock has paid a dividend that has gradually increased for many years, rising from $2.75 ten years ago to the $5.41 dividend payment, D0, that the company just recently made. If the…arrow_forwardPhosfranc Inc. is valuing the equity of a company using the free cash flow from equity, FCFE, approach and has estimated that the FCFE in the next three years will be $6.25, $7.70, and $8.36 million respectively. Beginning in year 4, the company expects the cash flows to increase at a rate of 4 percent per year for the indefinite future. It is estimated that the cost of equity is 12 percent. What is the value of equity in this company? (Do not round intermediate computations. Round final answer to the nearest million.) A) $77 million B) $95 million C) $109 million D) $60 millionarrow_forward
- As part of her analysis of the annual distribution policy and its impact on the firm’s value, she makes the following calculations and observations: • The company generated a free cash flow (FCF) of $45.00 million in its most recent fiscal year. • The firm’s cost of capital (WACC) is 14%. The firm has been growing at 10% for the past six years but is expected to grow at a constant rate of 8% in the future. • The firm has 11.25 million shares outstanding. • The company has $120.00 million in debt and $75.00 million in preferred stock. Along with the rest of the finance team, Elle has been part of board meetings and knows that the company is planning to distribute $120.00 million, which is invested in short-term investments, to its shareholders by buying back stock from its shareholders. Elle also observed that, at this point, apart from the $120.00 million in short-term investments, the firm has no other nonoperating assets. Using results from Elle’s calculations and…arrow_forwardBartman Industries' and Reynolds Inc.'s stock prices and dividends, along with the Winslow 5000 Index, are shown here for the period 2015-2020. The Winslow 5000 data are adjusted to include dividends. 1.) Use the data to calculate annual rates of return for Bartman, Reynolds, and the Winslow 5000 Index. Then calculate each entity's average return over the 5-year period. (Hint: Remember, returns are calculated by subtracting the beginning price from the ending price to get the capital gain or loss, adding the dividend to the capital gain or loss, and dividing the result by the beginning price. Assume that dividends are already included in the index. Also, the rates of return for 2015 are not avaiable because 2014 data are not given). Bartman Industries Reynolds Inc. Winslow 5000 Year Stock Price Dividend Holding period return Stock Price Dividend Holding period return Includes Divs. Holding period return 2020 $17.25 $1.15 $48.75 $3.00 11,663.98 2019 14.75…arrow_forwardWhite Lion Homebuilders has a current stock price of $27 per share, and is expected to pay a per-share dividend of $4.60 at the end of next year. The company’s earnings and dividends growth rate are expected to grow at a constant rate of 5.10% into the foreseeable future. If Alpha Moose expects to incur flotation costs of 3.90% of the value of its newly-raised equity funds, then the flotation-adjusted (net) cost of its new common stock (rounded to two decimal places) should be _____? (22.83%, 21.69%, 18.26%, or 26.25%) Please answer fast I give you like.arrow_forward
 EBK CONTEMPORARY FINANCIAL MANAGEMENTFinanceISBN:9781337514835Author:MOYERPublisher:CENGAGE LEARNING - CONSIGNMENT
 Fundamentals of Financial Management, Concise Edi...FinanceISBN:9781305635937Author:Eugene F. Brigham, Joel F. HoustonPublisher:Cengage Learning
 Fundamentals of Financial Management, Concise Edi...FinanceISBN:9781285065137Author:Eugene F. Brigham, Joel F. HoustonPublisher:Cengage Learning
 Fundamentals Of Financial Management, Concise Edi...FinanceISBN:9781337902571Author:Eugene F. Brigham, Joel F. HoustonPublisher:Cengage Learning