
Concept explainers
Videos
a.
Obtain the margin of error for the proportion of all adult Wisconsin residents thinking that things are going in the wrong direction for 90% confidence.
a.
Answer to Problem 5E
The margin of error for the proportion of all adult Wisconsin residents who think things are going in the wrong direction for 90% confidence is 0.039 or 3.9%.
Explanation of Solution
Calculation:
The survey conducted by St. Norbert’s College in Green Bay, Wisconsin and Wisconsin Public Radio on the sample of 402 Wisconsin resident adults, 66% said that things in the country are going in the wrong direction.
Margin of error:
The margin of error for the estimate of proportion, p is,
Where,
Critical value for 90% confidence:
Software Procedure:
Step-by-step procedure to obtain the critical value using the MINITAB software:
- Choose Graph > Probability Distribution Plot choose View Probability > OK.
- From Distribution, choose ‘Normal’ distribution.
- Enter Mean as 0.0 and standard deviation as 1.0.
- Click the Shaded Area tab.
- Choose Probability Value and Both Tail for the region of the curve to shade.
- Enter the Probability as 0.10.
- Click OK.
Output using the MINITAB software is given below:
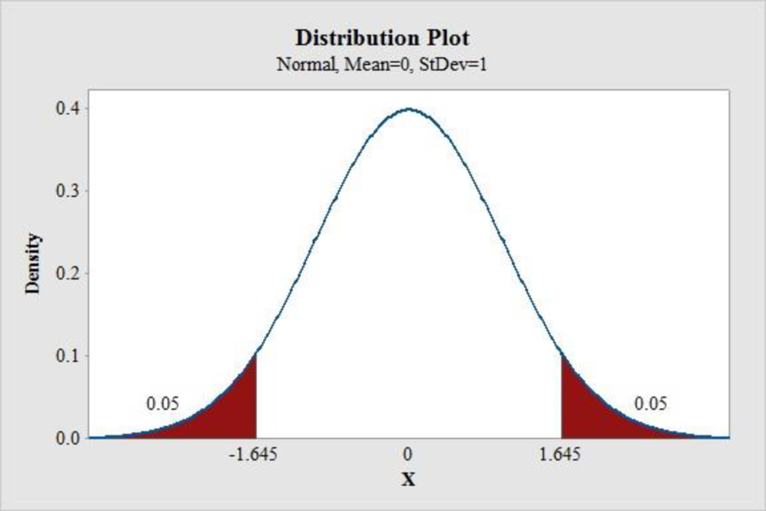
From the MINITAB output, the critical values at 90% confidence are
The margin of error is:
Substitute z as 1.645,
Thus, the margin of error for the proportion of all adult Wisconsin residents who think things are going in the wrong direction for 90% confidence is 0.039 or 3.9%.
b.
Explain whether the margin of error is larger or smaller for 95% confidence.
b.
Answer to Problem 5E
The margin of error is larger for 95% confidence.
Explanation of Solution
Justification:
Critical value for 95% confidence:
Software Procedure:
Step-by-step procedure to obtain the critical value using the MINITAB software:
- Choose Graph > Probability Distribution Plot choose View Probability > OK.
- From Distribution, choose ‘Normal’ distribution.
- Enter Mean as 0.0 and standard deviation as 1.0.
- Click the Shaded Area tab.
- Choose Probability Value and Both Tail for the region of the curve to shade.
- Enter the Probability as 0.05.
- Click OK.
Output using the MINITAB software is given below:
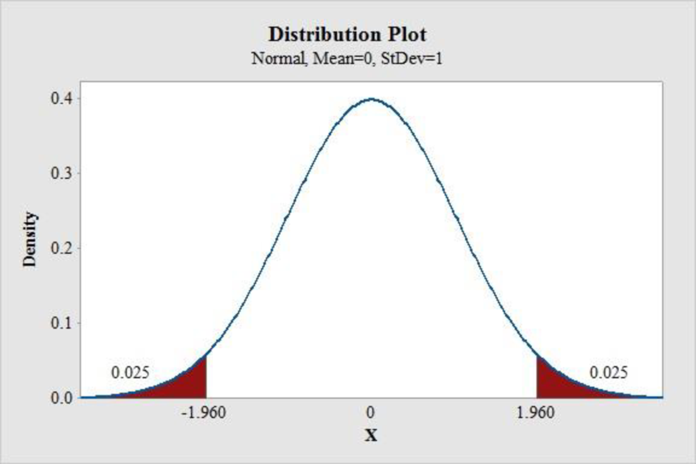
From the MINITAB output, the critical values at 95% confidence are
For this particular problem, the values of n,
The critical value for 95% confidence is 1.96 which is greater than the critical value 1.645 of 90% confidence.
Therefore, the margin of error for 95% confidence is larger than that obtained for the 90% confidence.
Want to see more full solutions like this?
Chapter 18 Solutions
STATS:DATA+MODELS-W/DVD


 MATLAB: An Introduction with ApplicationsStatisticsISBN:9781119256830Author:Amos GilatPublisher:John Wiley & Sons Inc
 Probability and Statistics for Engineering and th...StatisticsISBN:9781305251809Author:Jay L. DevorePublisher:Cengage Learning
 Statistics for The Behavioral Sciences (MindTap C...StatisticsISBN:9781305504912Author:Frederick J Gravetter, Larry B. WallnauPublisher:Cengage Learning
 Elementary Statistics: Picturing the World (7th E...StatisticsISBN:9780134683416Author:Ron Larson, Betsy FarberPublisher:PEARSON
 The Basic Practice of StatisticsStatisticsISBN:9781319042578Author:David S. Moore, William I. Notz, Michael A. FlignerPublisher:W. H. Freeman
 Introduction to the Practice of StatisticsStatisticsISBN:9781319013387Author:David S. Moore, George P. McCabe, Bruce A. CraigPublisher:W. H. Freeman