
Statistics for Business & Economics, Revised (MindTap Course List)
12th Edition
ISBN: 9781285846323
Author: David R. Anderson, Dennis J. Sweeney, Thomas A. Williams, Jeffrey D. Camm, James J. Cochran
Publisher: South-Western College Pub
expand_more
expand_more
format_list_bulleted
Concept explainers
Videos
Textbook Question
Chapter 18.4, Problem 29E
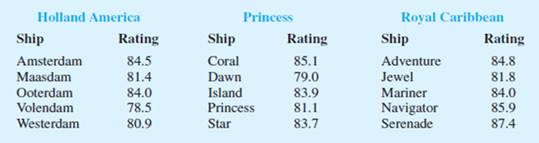
Condé Nast Traveler magazine conducts an annual survey of its readers in order to rate the top 80 cruise ships in the world (Condé Nast Traveler, February 2008). With 100 the highest possible rating, the overall ratings for a sample of ships from the Holland America, Princess, and Royal Caribbean cruise lines are shown. Use the Kruskal-Wallis test with α = .05 to determine whether the overall ratings among the three cruise lines differ significantly. What is your conclusion?
Expert Solution & Answer
Want to see the full answer?
Check out a sample textbook solution
Students have asked these similar questions
31% of all pygmy softshell tortoises have stripes on their shells. A herpetologist in Cititon collects a sample of 28 pygmy softshell tortoises and finds that 8 of them have stripes on their shells. Is there enough evidence to conclude, at a significance of alpha = 0.05, that the proportion of pygmy softshell tortoises in Cititon with stripes on their shells is less than 31%? What is the claim? What is the null hypothesis? What is the alternative hypothesis? What is the test statistic? What is/are the critical value(s)? Do we reject the null hypothesis? What conclusion do we draw? What is the P-value for the problem above?
31% of all pygmy softshell toises have stripes on their shells. A herpetologist in Cititon collects a sample of 28 pygmy softshell tortoises and finds that 8 of them have stripes on their shells. Is there enough evidence to conclude, at a significance of alpha=0.05, that the proportion of pygmy softshell tortoises in Cititon with stripes on their shells is less than 31%? What is the claim? What is the null hypothesis? What is the alternative hypothesis? What is the test statistic? What is/are the critical value(s)? Do we reject the null hypothesis? What conclusion do we draw? What is the P-value for the problem above?
In a survey of
460
drivers from the South,
397
wear a seat belt. In a survey of
340
drivers from the Northeast,
281
wear a seat belt. At
alpha equals 0.06
,
can you support the claim that the proportion of drivers who wear seat belts is greater in the South than in the Northeast? Assume the random samples are independent. Complete parts (a) through (e).
Chapter 18 Solutions
Statistics for Business & Economics, Revised (MindTap Course List)
Ch. 18.1 - The following hypothesis test is to be conducted....Ch. 18.1 - Ten individuals participated in a taste test...Ch. 18.1 - The median number of part-time employees at...Ch. 18.1 - Net assets for the 50 largest stock mutual funds...Ch. 18.1 - The median annual income of subscribers to...Ch. 18.1 - The median annual income for families living in...Ch. 18.1 - Prob. 7ECh. 18.1 - A Pew Research Center survey asked adults if their...Ch. 18.1 - A poll taken during the recession in 2008 asked...Ch. 18.1 - Prob. 10E
Ch. 18.1 - Competition in the personal computer market is...Ch. 18.2 - Two fuel additives are tested to determine their...Ch. 18.2 - A sample of 10 men was used in a study to test the...Ch. 18.2 - Percents of on-time arrivals for flights in the...Ch. 18.2 - A test was conducted for two overnight mail...Ch. 18.2 - The PGA Players Championship was held at the...Ch. 18.2 - The Scholastic Aptitude Test (SAT) consists of...Ch. 18.3 - Two fuel additives are being tested to determine...Ch. 18.3 - Samples of starting annual salaries for...Ch. 18.3 - The gap between the earnings of men and women with...Ch. 18.3 - Prob. 21ECh. 18.3 - Each year Bloomberg Businessweek publishes...Ch. 18.3 - Police records show the following numbers of daily...Ch. 18.3 - A certain brand of microwave oven was priced at 10...Ch. 18.3 - Prob. 25ECh. 18.4 - A sample of 15 consumers provided the following...Ch. 18.4 - Three admission test preparation programs are...Ch. 18.4 - Forty-minute workouts of one of the following...Ch. 18.4 - Cond Nast Traveler magazine conducts an annual...Ch. 18.4 - A large corporation sends many of its first-level...Ch. 18.4 - The better-selling candies are often high in...Ch. 18.5 - Consider the following set of rankings for a...Ch. 18.5 - Prob. 33ECh. 18.5 - Prob. 34ECh. 18.5 - A national study by Harris Interactive, Inc.,...Ch. 18.5 - Prob. 36ECh. 18.5 - A student organization surveyed both current...Ch. 18 - A survey asked the following question: Do you...Ch. 18 - Due to a recent decline in the housing market, the...Ch. 18 - Twelve homemakers were asked to estimate the...Ch. 18 - Prob. 41SECh. 18 - The following data are product weights for the...Ch. 18 - A client wants to determine whether there is a...Ch. 18 - Prob. 44SECh. 18 - Prob. 45SECh. 18 - Prob. 46SECh. 18 - Prob. 47SE
Knowledge Booster


Learn more about
Need a deep-dive on the concept behind this application? Look no further. Learn more about this topic, statistics and related others by exploring similar questions and additional content below.Similar questions
- In a recent study of a random sample of 113 people, 92 reported dreaming in color. In the 1940’s, the proportion of people who reported dreaming in color was 29%. Is there evidence to show that the proportion of people who dream in color is different than the proportion in the 1940’s? What is the critical value for this hypothesis test? In a recent study of a random sample of 113 people, 92 reported dreaming in color. In the 1940’s, the proportion of people who reported dreaming in color was 29%. Is there evidence to show that the proportion of people who dream in color is different than the proportion in the 1940’s? What is the critical value for this hypothesis test? \pm1.96±1.96 \pm1.645±1.645 \pm2.575±2.575 \pm2.05±2.05 \pm2.33±2.33arrow_forwardIn analyzing the consumption of cottage cheese by members of various occupational groups, the United Dairy Industry Association found that 326 of 837 professionals seldom or never ate cottage cheese, versus 220 of 489 white-collar workers and 522 of 1243 blue-collar workers (Sheet 53). Assuming independent samples, use the 0.03 level in testing the null hypothesis that the population proportions could be the same for the three occupational groups. Sheet 53 Group 1 Group 2 Group 3 Total seldom or never 326 220 522 1068 often 511 269 721 1501 Total 837 489 1243 2569 Select one: a) chi-square stat = 4.81, crit. value = 7.01, fail to reject H0, population proportions are not different b) p-value = 0.09, reject H0, population proportions are not different c) chi-square stat = 4.81, crit. value = 9.2, fail to reject H0, population proportions are not different d) p-value = 0.029, reject H0, population proportions differentarrow_forwardA local dairy conducted taste tests of their nonfat and low fat cream cheese spreads at three supermarkets on one Saturday. They asked people to compare a cracker with their low fat spread on it and another cracker with the nationally known brand of the same type of spread. At one supermarket, everyone who came to the testing table, located just inside by the front door, and asked to participate was included. At a second market, only people who appeared to be older teenagers and adults were allowed to participate. The testing table was in the section of the store where paper goods are sold. At the third store, the testing table was in the dairy section and everyone who was asked to participate was included. However, they ran out of one of the products and had to stop the test three hours earlier than they planned. The table below shows how many people were tested at each location and their stated preferences Store A Store B Store C Number tasters = 258Number preferring local brand…arrow_forward
Recommended textbooks for you
 Holt Mcdougal Larson Pre-algebra: Student Edition...AlgebraISBN:9780547587776Author:HOLT MCDOUGALPublisher:HOLT MCDOUGAL
Holt Mcdougal Larson Pre-algebra: Student Edition...
Algebra
ISBN:9780547587776
Author:HOLT MCDOUGAL
Publisher:HOLT MCDOUGAL
Statistics 4.1 Point Estimators; Author: Dr. Jack L. Jackson II;https://www.youtube.com/watch?v=2MrI0J8XCEE;License: Standard YouTube License, CC-BY
Statistics 101: Point Estimators; Author: Brandon Foltz;https://www.youtube.com/watch?v=4v41z3HwLaM;License: Standard YouTube License, CC-BY
Central limit theorem; Author: 365 Data Science;https://www.youtube.com/watch?v=b5xQmk9veZ4;License: Standard YouTube License, CC-BY
Point Estimate Definition & Example; Author: Prof. Essa;https://www.youtube.com/watch?v=OTVwtvQmSn0;License: Standard Youtube License
Point Estimation; Author: Vamsidhar Ambatipudi;https://www.youtube.com/watch?v=flqhlM2bZWc;License: Standard Youtube License