
Calculate the average tax rate and identify the tax in nature.
Explanation of Solution
The average tax rate can be calculated by using formula as follows:
Substitute the respective values in Equation (1) to calculate the average tax rate for the total income $35,000 as shown below:
The average tax rate for the total income $35,000 is 0.
Table-1 shows the values of the average tax rate for different income groups obtained by using Equation (1).
Table-1
| Total income |
Average tax rate |
|
$50,000 |
6.0% |
|
$65,000 |
9.2% |
|
$80,000 |
11.3% |
|
$ 100,000 |
13.0% |
|
$125,000 |
14.4% |
From table-1, it is clear that the tax is progressive in nature. There is no tax for the first $35,000. When the income rises, the tax rate also rises.
Figure-1 represents the graphical representation of the average tax rate of these different income levels.
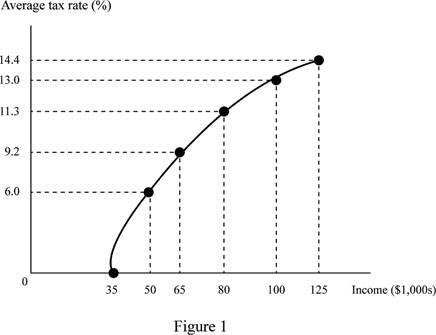
In figure-1, the horizontal axis shows the income levels and the vertical axis shows the average tax rate. When the income rises the average tax rate also rises. Therefore the tax is progressive in nature.
Progressive tax: The progressive tax refers to the higher income people paying a higher tax amount than the lower income people.
Want to see more full solutions like this?
Chapter 19 Solutions
MyLab Economics with Pearson eText -- Access Card -- for Principles of Microeconomics

- In the budget presented by the government, far reaching tax rebates are provided to all classes of tax payers. A researcher therefore conducts a survey to examine whether these tax reductions have led to a change in the consumption patterns of various social classes in the country. What kind of study would this fall under? Explain your answer.arrow_forwardPresident Biden has proposed a $2.2 trillion Infrastructure package to repair roads and bridges. The exact source of the funds is unclear at the time of construction of this exam, but some policy analysts think that at least one part of the funding will be an increase in the federal excise tax on gasoline. Suppose the size of this increase in excise tax is written as t. Using a graph and equilibrium, analyze and explain the impact of this t dollars per gallon increase in excise tax on gasoline. Which of the curve(s), if any, would shift, and why? Graphically, show the new equilibrium price and quantity (labeling it P1 and Q1). At the new equilibrium, please determine how much of the tax increase was borne by gasoline consumers and how much was absorbed by gasoline sellers? Indicate the incidence of taxation for both consumers and sellers on the graph and explain. What will determine whether consumers or sellers will bear a higher relative burden of taxation? Please explain in detail.arrow_forwardThe Laffer curve illustrates the concept that a.an increase in marginal tax rates will always cause tax revenues to decrease. b.when marginal tax rates are quite high, a decrease in the tax rate may cause tax revenues to increase. c.when marginal taxes are quite low, an increase in the tax rate will probably cause tax revenues to decline. d.an increase in marginal tax rates will always cause tax revenues to increase.arrow_forward
- 1/2 of the population is unemployed with $500 in income; the other 1/2 are employed and earn $50,000 each individual has the utility function: U=4x(1/2) where x=individual's income Proposal 1) government taxes everyone with income at a flat rate of 10%. From the tax revenue, the government will refund the same amount to each person; regardless of their income Proposal 2) government taxes everyone at a flat rate of 10%. It will refund the same amount to each person according to the percentage of taxes paid. Question: compare the proposals under the utilitarian and Rawlsian social welfare functions. How do these proposals rank under each social welfare function? (all calculations can be done on a per-capita basis).arrow_forwardAccording to the textbook, which of the following statements is (are) correct? (x) Taxes on specific goods such as cigarettes, gasoline and alcoholic beverages are called excise taxes (y) The government taxes corporate income on the basis of the number of employees. (z) The payroll tax differs from the individual income tax because all of the payroll tax is paid by the employer and all of the income tax is paid by the employee. (x), (y) and (z) (x) and (y) only (x) and (z) only (y) and (z) only (x) onlyarrow_forwardThe main difference between variable taxes and fixed taxes is that unlike fixed taxes, variable taxes . The following graph shows the consumption schedule for an economy with a given level of taxes. Suppose the government implements a tax increase through a fixed tax. Use two green points (triangle symbol) to connect the two black points (plus symbols) representing the consumption schedule after the change in taxes. Hint: The new consumption schedule must pass through one point on the left and one point on the right. The blue line on the next graph represents the original total expenditure line for this economy before the change in tax structure. Use the new consumption line you just plotted to calculate the new total expenditure at two levels of real GDP and fill in the following table. GDP level Total Expenditure (Billions of dollars) (Billions of dollars) 10 90 Use the green points (triangle symbols) to draw the new total…arrow_forward
- Please solve with reference to the diagram, calculate the equilibrium level of income after the introduction of government spending and proportional income tax. Show all calculation stepsarrow_forwardWhich of the following statements is (are) correct? (x) One of the largest categories of federal government spending is Social Security and it is growing because the elderly population is increasing due to longer life expectancy for U.S citizens. (y) Although government spending on national defense includes weapons, military vehicles, and salaries of military personnel, tax revenue is not used to pay for those items. (z) The largest single expenditure category for most state and local governments is education. (x), (y) and (z) (x) and (y) only (x) and (z) only (y) and (z) only (x) onlyarrow_forwardWhich of the following is an example of the circular flow of income that shows the interdependence of households and firms? Group of answer choices Firms in the factor markets pay households in the form of wages, interest, rent and profit for the resources that households supplied. Households supply their resources to the firms in the product markets and, in turn, demand in the factors market the goods and services produced by firms. Households demand their resources from firms in the factors’ market and, in turn, supply in the product market the goods and services produced by firms. Firms supply resources that households demand in the factors’ market and, in turn, provide households with the goods and services produced for the product market.arrow_forward
- Logically discuss the impact of the increase in government taxes on consumption.arrow_forwardSuppose there is a bill to increase the tax on cigarettes by $1 per pack coupled with an income tax cut of $500. Suppose a person smokes an average of 500 packs of cigarettes per year—and would thus face a tax increase of about $500 per year from the cigarette tax at the person’s current level of consumption. The income tax measure would increase the person’s after-tax income by $500. Would the combined measures be likely to have any effect on the person’s consumption of cigarettes? Why or why not?arrow_forwardUse the circular flflow diagram to show how each of the following government actions simultaneously affects the allocation of resources and the distribution of income:a. The construction of a new high school.b. A 2-percentage-point reduction of the corporate income tax.c. An expansion of preschool programs for disadvantaged children.d. The levying of an excise tax on polluters.arrow_forward

 Economics (MindTap Course List)EconomicsISBN:9781337617383Author:Roger A. ArnoldPublisher:Cengage Learning
 Economics: Private and Public Choice (MindTap Cou...EconomicsISBN:9781305506725Author:James D. Gwartney, Richard L. Stroup, Russell S. Sobel, David A. MacphersonPublisher:Cengage Learning
