1.
Cost-Volume-Profit Analysis: It is a method followed to analyze the relationship between the sales, costs, and the related profit or loss at various levels of units sold. In other words, it shows the effect of the changes in the cost and the sales volume on the operating income of the company.
To construct: a cost-volume-profit chart indicating the break-even sales for last year.
1.
Explanation of Solution
Construct a cost-volume-profit chart indicating the break-even sales for last year.
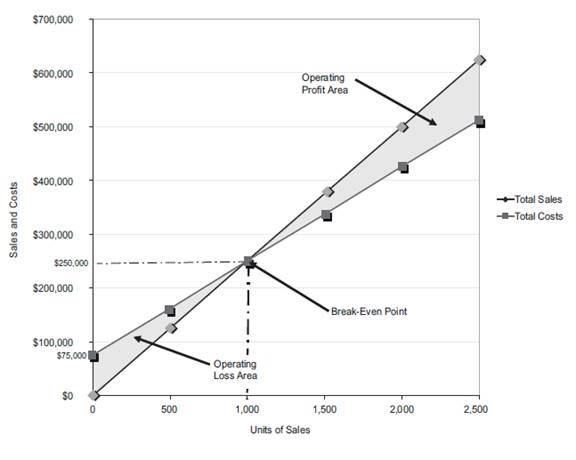
Figure (1)
The volume in units of sales is shown on the horizontal axis. The maximum relevant range is 2,500 units. The sales and the total costs (fixed cost and variable cost) in dollars is shown on the vertical axis. The maximum relevant range of sales and total costs is $700,000.
The total sales line is drawn right upward by connecting the first point at $0 to the second point at $625,000
The total cost line is drawn right upward by connecting the first point at $75,000 (fixed cost) on the vertical axis to the second point at $512,500
The break-even point is the intersection point where the total sales line and total cost line meet. The vertical dotted line drawn downward from the intersection point reaches at 1,000 units. It indicates the break-even sales (units). The horizontal line drawn to the left towards the vertical axis reaches at $250,000. It indicates the break-even sales (dollars).
The operating profit area is the area where the total sales line exceeds the total cost line. However, the operating loss area is the area where the total cost exceeds the total sales line.
2(A)
The income from operations for last year
2(A)
Explanation of Solution
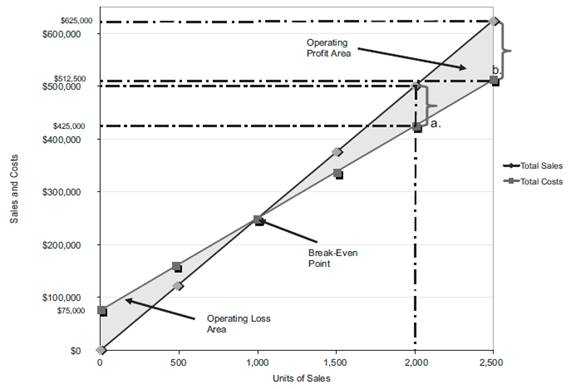
Figure (2)
Last year, the number of units sold is 2,000 units (3). The total sales is $500,000. The total cost is
Similarly, a dotted line is drawn from the total cost at $425,000 on the vertical axis towards the right and a dotted line is drawn upward for the 2,000 units sold from the horizontal axis. The two dotted line meet at a point which indicates the point of total cost at 2,000 units.
The dotted line from sales is above the dotted line for total cost. This indicates the income from operations. Thus, the area in between the two dotted lines is the income from operations of
2(B)
The maximum income from operations realized during the year.
2(B)
Explanation of Solution
The maximum relevant range for number of units to be sold is 2,500 units. Thus, the total sale is
Similarly, a dotted line is drawn from the total cost at $512,500 on the vertical axis towards the right and a dotted line is drawn upward for the 2,500 units sold from the horizontal axis. The two dotted line meet at a point which indicates the point of total cost at 2,500 units.
The dotted line from sales is above the dotted line for total cost. This indicates the income from operations. Thus, the area in between the two dotted lines is the income from operations of
2(A)
To verify: the answers using the mathematical approach to cost-volume-profit analysis.
2(A)
Explanation of Solution
Verify the answers using the mathematical approach to cost-volume-profit analysis.
Determine the income from operations for the last year.
| Determine the income from operations for 2,000 units | ||
| Particulars | Amount ($) | Amount ($) |
| Sales | 500,000 | |
| Less: Fixed costs | 75,000 | |
| Variable costs
|
350,000 | (425,000) |
| Income from operations | 75,000 | |
Table (1)
Working note:
Determine the number of units sold.
Sales =$500,000
Selling price per unit =$250 per unit
2(B)
the maximum income from operations that could have been realized during the year.
2(B)
Explanation of Solution
| Determine the income from operations for 2,500 units | ||
| Particulars | Amount ($) | Amount ($) |
| Sales
|
625,000 | |
| Less: Fixed costs | 75,000 | |
| Variable costs
|
437,500 | (512,500) |
| Income from operations | 112,500 | |
Table (2)
3.
To construct: a cost-volume-profit chart indicating the break-even sales for the current year.
3.
Explanation of Solution
Construct a cost-volume-profit chart indicating the break-even sales for the current year.
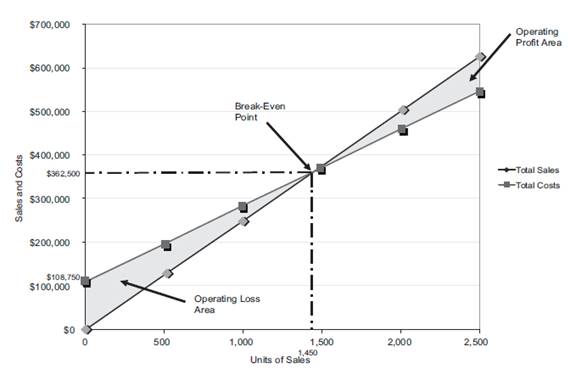
Figure (3)
The volume in units of sales is shown on the horizontal axis. The maximum relevant range is 2,500 units. The sales and the total costs (fixed cost and variable cost) in dollars is shown on the vertical axis. The maximum relevant range of sales and total costs is $700,000.
The total sales line is drawn right upward by connecting the first point at $0 to the second point at $625,000
The total cost line is drawn right upward by connecting the first point at
The break-even point is the intersection point where the total sales line and total cost line meet. The vertical dotted line drawn downward from the intersection point reaches at 1,450 units. It indicates the break-even sales (units). The horizontal line drawn to the left towards the vertical axis reaches at $362,500. It indicates the break-even sales (dollars).
The operating profit area is the area where the total sales line exceeds the total cost line. However, the operating loss area is the area where the total cost exceeds the total sales line.
4(A)
the income from operations for sales 2,000 units
4(A)
Explanation of Solution
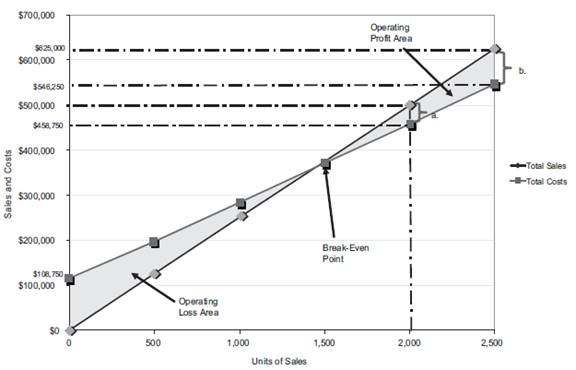
Figure (4)
Last year, the number of units sold is 2,000 units (3). The total sales is $500,000. The total cost is
Similarly, a dotted line is drawn from the total cost at $458,750 on the vertical axis towards the right and a dotted line is drawn upward for the 2,000 units sold from the horizontal axis. The two dotted line meet at a point which indicates the point of total cost at 2,000 units.
The dotted line from sales is above the dotted line for total cost. This indicates the income from operations. Thus, the area in between the two dotted lines is the income from operations of
4(B)
The maximum income from operations that could have been realized during the year.
4(B)
Explanation of Solution
The maximum relevant range for number of units to be sold is 2,500 units. Thus, the total sales is
Similarly, a dotted line is drawn from the total cost at $546,250 on the vertical axis towards the right and a dotted line is drawn upward for the 2,500 units sold from the horizontal axis. The two dotted line meet at a point which indicates the point of total cost at 2,500 units.
The dotted line from sales is above the dotted line for total cost. This indicates the income from operations. Thus, the area in between the two dotted lines is the income from operations of
4(A)
To verify: the answers using the mathematical approach to cost-volume-profit analysis.
4(A)
Explanation of Solution
Verify the answers using the mathematical approach to cost-volume-profit analysis.
Determine the income from operations for the last year.
| Determine the income from operations for 2,000 units | ||
| Particulars | Amount ($) | Amount ($) |
| Sales | 500,000 | |
| Less: Total Fixed costs
|
108,750 | |
| Variable costs
|
350,000 | (458,750) |
| Income from operations | 41,250 | |
Table (3)
4(B)
the maximum income from operations that could have been realized during the year.
4(B)
Explanation of Solution
| Determine the income from operations for 2,500 units | ||
| Particulars | Amount ($) | Amount ($) |
| Sales
|
625,000 | |
| Less: Total Fixed costs
|
108,750 | |
| Variable costs
|
437,500 | (546,250) |
| Income from operations | 78,750 | |
Table (4)
Want to see more full solutions like this?
Chapter 19 Solutions
Bundle: Financial & Managerial Accounting, Loose-Leaf Version, 13th + CengageNOWv2, 2 terms (12 months) Printed Access Card + Hydro Paddle Boards ... 2 terms (12 months) Printed Access Card

- Margin of safety Jorgensen Company has sales of 380,000,000, and the break-even point in sales dollars is 323,000,000. Determine Jorgensen Companys margin of safety as a percent of current sales.arrow_forwardBreak-even sales under present and proposed conditions Portmann Company, operating at full capacity, sold 1,000,000 units at a price of 188 per unit during the current year. Its income statement is as follows: The division of costs between variable and fixed is as follows: Management is considering a plant expansion program for the following year that will permit an increase of 11,280,000 in yearly sales. The expansion will increase fixed costs by 5,000,000 but will not affect the relationship between sales and variable costs. Instructions 1. Determine the total variable costs and the total fixed costs for the current year. 2. Determine (a) the unit variable cost and (b) the unit contribution margin for the current year. 3. Compute the break-even sales (units) for the current year. 4. Compute the break-even sales (units) under the proposed program for the following year. 5. Determine the amount of sales (units) that would be necessary under the proposed program to realize the 60,000,000 of operating income that was earned in the current year. 6. Determine the maximum operating income possible with the expanded plant. 7. If the proposal is accepted and sales remain at the current level, what will the operating income or loss be for the following year? 8. Based on the data given, would you recommend accepting the proposal? Explain.arrow_forwardCost-Volume-Profit, Margin of Safety Victoria Company produces a single product. Last years income statement is as follows: Required: 1. Compute the break-even point in units and sales dollars calculated using the break-even units. 2. What was the margin of safety for Victoria last year in sales dollars? 3. Suppose that Victoria is considering an investment in new technology that will increase fixed cost by 250,000 per year but will lower variable costs to 45% of sales. Units sold will remain unchanged. Prepare a budgeted income statement assuming that Victoria makes this investment. What is the new break-even point in sales dollars, assuming that the investment is made?arrow_forward
 Managerial AccountingAccountingISBN:9781337912020Author:Carl Warren, Ph.d. Cma William B. TaylerPublisher:South-Western College Pub
 Financial And Managerial AccountingAccountingISBN:9781337902663Author:WARREN, Carl S.Publisher:Cengage Learning,
 Managerial Accounting: The Cornerstone of Busines...AccountingISBN:9781337115773Author:Maryanne M. Mowen, Don R. Hansen, Dan L. HeitgerPublisher:Cengage Learning
 Cornerstones of Cost Management (Cornerstones Ser...AccountingISBN:9781305970663Author:Don R. Hansen, Maryanne M. MowenPublisher:Cengage Learning