
Concept explainers
Videos
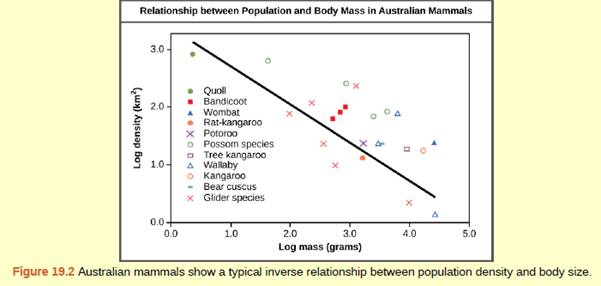
Figure 19.2 As this graph shows, population density typically decreases with increasing body size. Why do you think this is the case?
To write:
The population density depending upon the body size of the organisms.
Introduction:
Populations are dynamic entities. In response to various factors, their size and composition change, including seasonal and annual changes in the environment, natural disasters such as volcanic eruptions, forest fires, and competition between or within species for resources.
Explanation of Solution
The graph depicts a density-dependent population. Populations are identified by population size and population density. A population can have a large number of people densely or sparsely distributed. There are also populations with small amounts of individuals that can be dense or very slightly distributed in a local area. Population size may affect the adaptation potential as it affects the number of genetic variation in the population. Density can affect interactions in a population such as food competition and individuals ' ability to find a partner. Smaller individuals are more densely distributed than larger individuals.
Thus, the size of the body is regulating the density of the population. The population with smaller body size shows more density than those which have a larger body size.
Want to see more full solutions like this?
Chapter 19 Solutions
Concepts of Biology
Additional Science Textbook Solutions
College Physics
Microbiology with Diseases by Body System (4th Edition)
Concepts of Genetics (12th Edition)
Human Anatomy & Physiology (2nd Edition)
Campbell Essential Biology with Physiology (6th Edition)
Microbiology: An Introduction


- Figure 45.16 Age structure diagrams for rapidly growing, slow growing, and stable populations are shown in stages 1 through 3. What type of population change do you think stage 4 represents?arrow_forwardIn a graph of population size versus time, a J-shaped curve is characteristic of (a) exponential population growth (b) logistic population growth (c) zero population growth (d) replacement-level fertility (e) population growth momentumarrow_forwardShown is an age pyramid of Brazil in the year 2021. Describe its shape. What does the shape of the age pyramid tell you about their population? What can be said about the birth rates and death rates.arrow_forward
- Which statement about population growth is true? A. Population growth models do not apply to humans. B. Population growth can be exponential for only as long as environmental conditions are favorable. C. Population growth can continue indefinitely. D. Population growth of field samples always has a λ of approximately 1.arrow_forwardSince K = 0.5, the population we are studying is experiencing ________ growth due to density _______ factors. exponential; dependent exponential; independent logistic; dependent logistic; independentarrow_forwardWhich of the following is a factor that would decrease the size of a population? A. Death rate is higher than the birth rate B. Abundant food supply C. Immigration D. Birth rate is higher than the death ratearrow_forward
- If population growth is assumed to be density dependent in all four populations, what will happen to these populations sometime after generation 10? 1. Population size will grow monotonically. 2. Rate of population growth will decrease. 3. Rate of population growth will remain the same. 4. All populations will follow the curve of populationarrow_forwardYou start a lab colony of Rotifers (small aquatic animals) by adding 5 indviduals to a small tank. One week later the population has grown to 17. Assuming that the population is growing exponentially, how many rotifers can you expect after 7 weeks? Round your answer to the closest full number.arrow_forwardWhich of the following is a density-independent factor limiting population growth in humans? fatal genetic diseases temperature competition for food fatal contagious diseasesarrow_forward
- At which point (population size and time in months) is the population growth the fastest? (Format your answer following this example: N = 10 individuals, t = 12 months).arrow_forwardIf a population eventually reached the point where it no longer changed in size, which of the below must be true? Group of answer choices K > R0 N = K R0 = K/N r = K N > Karrow_forwardseveral years ago wolves were reintroduced in to a national park in North Carolina. Researchers have monitored the populations over the last several years and the per capita growth rate of the population is.5. If the current population size is 100, what equation would you use to determine how large he population will be in ten yearS? N/t *r N(1+r)^t (N*r)/t please highlight the answerarrow_forward
 Concepts of BiologyBiologyISBN:9781938168116Author:Samantha Fowler, Rebecca Roush, James WisePublisher:OpenStax College
 Biology 2eBiologyISBN:9781947172517Author:Matthew Douglas, Jung Choi, Mary Ann ClarkPublisher:OpenStax
 Biology Today and Tomorrow without Physiology (Mi...BiologyISBN:9781305117396Author:Cecie Starr, Christine Evers, Lisa StarrPublisher:Cengage Learning
 Biology (MindTap Course List)BiologyISBN:9781337392938Author:Eldra Solomon, Charles Martin, Diana W. Martin, Linda R. BergPublisher:Cengage Learning