Concept explainers
a)
To solve: The linear programming problem and answer the questions.
Introduction:
Linear programming:
Linear programming is a mathematical modelling method where a linear function is maximized or minimized taking into consideration the various constraints present in the problem. It is useful in making quantitative decisions in business planning.
a)
Explanation of Solution
Given information:
Calculation of coordinates for each constraint and objective function:
Constraint 1:
Constraint 2:
Constraint 3:
Constraint 4:
Objective function:
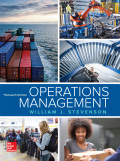
The problem is solved with iso-cost line method.
Graph:
(1) Optimal value of the decision variables and Z:
The coordinates for the cost line is (45, 55). The cost line is moved towards the origin. The lowest at which the cost line intersects in the feasible region will be the optimum solution. The following equation are solved as simultaneous equation to find optimum solution.
Solving (1) and (2) we get,
The values are substituted in the objective function to find the objective function value.
Optimal solution:
(2)
None of the constraints are having slack. All ≤ constraints are binding.
(3)
Protein and T constraint have surplus.
Protein:
The surplus is 92 (272 – 180).
T:
The surplus is 10 (20– 10).
(4)
The protein constraint is redundant because, it does not intersect at any point in the feasible region.
b)
To solve: The linear programming problem and answer the questions.
Introduction:
Linear programming:
Linear programming is a mathematical modelling method where a linear function is maximized or minimized taking into consideration the various constraints present in the problem. It is useful in making quantitative decisions in business planning.
b)
Explanation of Solution
Given information:
Calculation of coordinates for each constraint and objective function:
Constraint 1:
Constraint 2:
Constraint 3:
Objective function:
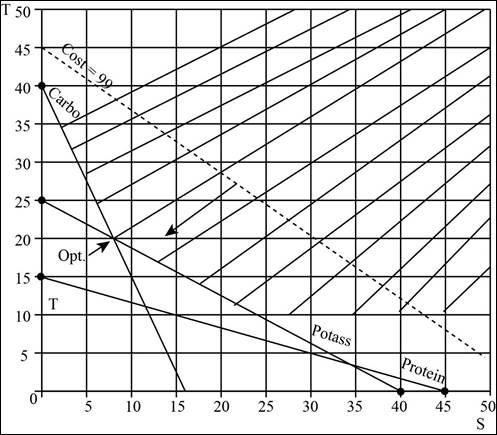
The problem is solved with iso-cost line method.
Graph:
(1) Optimal value of the decision variables and Z:
The coordinates for the cost line is (12, 8). The cost line is moved towards the origin. The lowest at which the cost line intersects in the feasible region will be the optimum solution. The following equation are solved as simultaneous equation to find optimum solution.
Solving (1) and (2) we get,
The values are substituted in the objective function to find the objective function value.
Optimal solution:
(2)
Constraint F is having slack as shown below.
The slack is 4.6 (12 – 7.4).
(3)
There are no surplus. D and E constraints with ≥ are binding.
(4)
There are no redundant constraints
Want to see more full solutions like this?
Chapter 19 Solutions
EBK OPERATIONS MANAGEMENT


- If a monopolist produces q units, she can charge 400 4q dollars per unit. The variable cost is 60 per unit. a. How can the monopolist maximize her profit? b. If the monopolist must pay a sales tax of 5% of the selling price per unit, will she increase or decrease production (relative to the situation with no sales tax)? c. Continuing part b, use SolverTable to see how a change in the sales tax affects the optimal solution. Let the sales tax vary from 0% to 8% in increments of 0.5%.arrow_forwardAn automobile manufacturer is considering whether to introduce a new model called the Racer. The profitability of the Racer depends on the following factors: The fixed cost of developing the Racer is triangularly distributed with parameters 3, 4, and 5, all in billions. Year 1 sales are normally distributed with mean 200,000 and standard deviation 50,000. Year 2 sales are normally distributed with mean equal to actual year 1 sales and standard deviation 50,000. Year 3 sales are normally distributed with mean equal to actual year 2 sales and standard deviation 50,000. The selling price in year 1 is 25,000. The year 2 selling price will be 1.05[year 1 price + 50 (% diff1)] where % diff1 is the number of percentage points by which actual year 1 sales differ from expected year 1 sales. The 1.05 factor accounts for inflation. For example, if the year 1 sales figure is 180,000, which is 10 percentage points below the expected year 1 sales, then the year 2 price will be 1.05[25,000 + 50( 10)] = 25,725. Similarly, the year 3 price will be 1.05[year 2 price + 50(% diff2)] where % diff2 is the percentage by which actual year 2 sales differ from expected year 2 sales. The variable cost in year 1 is triangularly distributed with parameters 10,000, 12,000, and 15,000, and it is assumed to increase by 5% each year. Your goal is to estimate the NPV of the new car during its first three years. Assume that the company is able to produce exactly as many cars as it can sell. Also, assume that cash flows are discounted at 10%. Simulate 1000 trials to estimate the mean and standard deviation of the NPV for the first three years of sales. Also, determine an interval such that you are 95% certain that the NPV of the Racer during its first three years of operation will be within this interval.arrow_forwardSuppose that a decision is faced with three decision alternatives and four states of nature.The following profit payoff table is constructed: ALTERNATIVES STATE OF NATURE S1 S2 S3 S4 A1 18 12 15 8 A2 15 14 10 11 A3 13 16 19 15 Assuming that the decision maker has no knowledge about the probabilities of occurrenceof the four states of nature, find the decisions to be recommended under each of thefollowing criteria:i. Maximin criterionii. Maximax criterioniii. Minimax Reject criterioniv. Hurwicz criterion with α = 0.6arrow_forward
- A manufacturer operates an existing factory in China. It wishes to open one more factory in either Indonesia, Malaysia or Vietnam to cope with the increasing demand. The markets it serves are Malaysia, Singapore and Thailand. Table 1 shows the annual demand from each market, the capacities and fixed costs of the existing and potential factories as well as the variable costs. Where should the manufacturer build its additional factory, if it wants to minimise cost? Table 1: Cost, Demand and Capacity State the objective function, constraints and decision variables. Then, analyse using Excel Solver to find out where the manufacturer should build its additional factory if it wants to minimise cost. Present your answer in a table, stating how many units which factory should supply to which market. Also, calculate and state the total cost of your network.arrow_forwardPROBLEM SOLVING (DECISION THEORY) Example: A farmer wants to decide which of the three crops he should plant on his 100 Acre farm. The profit from each is dependent on the rainfall during the growing seasons. The farmer has categorized the amount of rainfall as high, medium, low. His estimated profit for each is show in the table: Rainfall Crop A Crop B Crop C High 8000 3500 5000 Medium 4500 4500 5000 Low 2000 5000 4000 Determine the various criterion from which the final decision has to be made. If the farmer wishes to plant only one crop, decide which will be his choice using the following criterion•Maximax criterion •Maximin criterion •Hurwicz criterion •Laplace criterionarrow_forward[6] Please carefully read the following scenario:(Image attached)The total number of decision variables in this problem is:A. 5B. 3C. 4D. 2 [7] The total number of constraints in this problem, including non-negativity constraints is: A. 9 B. 5 C. 3D. 7arrow_forward
- A decision problem has the following three constraints: 70X + 6Y <= 420; 24X + 3Y= 72; and 11X - Y <= 14 . The objective function is Min 17X + 38Y . The objective function value is : a. 338 b. 676 c. unbounded d. infeasible e. 0arrow_forwardThe following payoff table shows a profit for a decision analysis problem with two decision alternatives and three states of nature. In order to get full credit, show your all work done step by step including cell calculations using excel functions. State of Nature Decion Alternatives s1 s2 s3 d1 250 100 50 d2 100 75 100 a) Construct a decision tree for this problem. b) Suppose that the decision-maker obtains the probabilities P(s1)=0.65, P(s2)=0.15, and P(s3)=0.20. Use the expected value approach to determine the optimal decision.arrow_forwardFormulate the LP model for each of the problem identified below. Clearly define the decision variables and the objective function The Burroughs Garment Company manufactures men’s shirts and women’s blouses for Walmark Discount Stores. Walmark will accept all the products supplied by Burroughs. The production process includes cutting, sewing, and packaging. Burroughs employs 25 workers in the cutting department, 35 in the sewing department, and 5 in the packaging department. The factory works one 8-hr shift, 5 days a week. Determine the optimal weekly production schedule for Burroughs. The following table gives the time requirements and profits per unit for the two garments.arrow_forward
- An investor is considering investing in stocks, real estate, or bonds economic conditions. Suppose that the probabilities for good, stable and poor conditions are 0.2, 0.4 and … (figure it out), respectively. Table 1 shows the payoff returns for the investor’s decision situation. Table 1: Investment returns Economic Conditions Investment Good Stable Poor Stocks R5 000 R7 000 R3 000 Real estate -R2 000 R10 000 R6 000 Bonds R4 000 R4 000 R4 000 Assuming the probabilities of the occurrence of the state of nature are unknown, what will be the best investment alternative; a) If the decision maker is pessimistic about the future state, (3) b) If the decision maker strikes a compromise between the maximin and maximax, assuming the coefficient of pessimism is 0.2. (4) c) If the decision is based on opportunistic loss. (6) d) If we use the equally likelihood criterionarrow_forwardUsing the template provided. Formulate a linear programming model (identify and define decision variables, objective function and constraints) that can be used to minimize the transportation cost of a logistics system that will deliver skateboards from the factories to the distribution centers and from the distribution centers to the retailers Use Solver in Microsoft Excel to solve the model. Give the values of each decision variable and the objective function. Please show how you solved it.arrow_forwardIn the problem on excel : 1.What are the decision variables 2.What is the objective functions 3. What are the 12 constraints and explain You won $750,000 from a lottery and, you have decided to come up with a list of possible investments that you will invest, all of the $750,000 that you have won. The expected return of each of the 6 possible investments that you are considering investing in,and their Expected Rate of Return over the next year are in the table below. Investment Expected Rate of return Amazon Inc (USA Shares) 13.5% Royal Bank of Canada (Canadian Shares) 7.4% Nike Inc (USA Shares) 10.0% Telus Corporation (Canadian Shares) 6.1% Snap Inc (USA Shares) 3.0% Nestle SA (Switzerland Shares) 4.8% it is important to have a diversified portfolio, and therefore have come up with the following guidelines on how to invest your money: 1.The total invested in USA Shares should be at least 10% but no more then 45% of the total…arrow_forward
 Practical Management ScienceOperations ManagementISBN:9781337406659Author:WINSTON, Wayne L.Publisher:Cengage,