Concept explainers
Videos
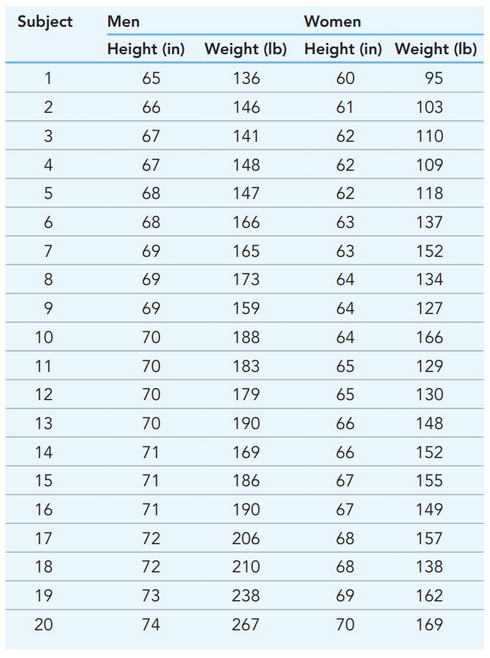
A total of
a. Draw one histogram for height of the subjects and a separate histogram for weight. Use different colors for men and women so that you can visually compare the distributions by sex and plot weights in
b. Calculate the mean, variance, and standard deviation for height and weight in men and women.
c. Compare the numerical values with the visual distribution of heights and weights you drew in the histograms and describe whether you think your visual impression matches the numerical values.
Want to see the full answer?
Check out a sample textbook solution
Chapter 19 Solutions
Pearson eText Genetic Analysis: An Integrated Approach -- Instant Access (Pearson+)


- please highlight the correct answerarrow_forwardTable 7.1: Your genetic traits. Your probable genotype(s) (use only the letter combinations that apply) Your phenotype (list what you look like) Traits (alleles) Almond Straight thumbs 1. Eye shape (R, r) 2. Hitcher's Thumb (H, h) 3. Earlobes (D, d) Free 4. Interlocking Fingers (I, i) Left thumb over right Widows Peak 5. Widow's Peak (F, f) 6. Face Shape (G, g) Oval 7. Eye Color (B, b) Brown 8. Chin Shape (J, j) Round Dimples Brown 9. Dimples (A, a) 10. Hair Color (K, k) Curly 11. Hair Texture (T, t) 12. PTC Taster (Q, q)arrow_forwardLow birth weight is defined as a birth weight of less than 6.5 pounds. True Falsearrow_forward
- Use these 2 pictures to answer all the questions completely and correctly.arrow_forwardA trait has a heritability of 0.15. This suggests: Question 5 options: The phenotypic variance is due entirely to genetic variation. The phenotypic variance is due entirely to environmental factors. The environment plays a much larger role in the phenotypic variance relative to genetics. Both genetic and environmental factors play similar roles in the phenotypic variation. Genetics plays a much larger role in the phenotypic variance relative to the environment.arrow_forwardPlease fill the charts completely and correctlyarrow_forward
- G = green hair. g = purple hair. One parent is GG. The other parent is Gg. Which statement would be true regarding this information? Group of answer choices There is a 100% chance that their child will have green hair. One parent is green hair and the other has purple hair. Both parents have purple hair. There is a 50% chance their child will have purple hair.arrow_forwardWhat is r for full siblings? Mother 1/2 Actor O r = 0.00 r = 0.25 O r=0.50 Or=1.00 1/2 Father 1/2 1/2 Recipientarrow_forwardExamine the autoradiogram below. Three loci of VNTRS from a mother (M), child (C) and three potential fathers (F1, F2, F3) of the child are shown. From your analysis of this data, are any of these men potentially the father of the child or not? If so, which one? Explain your answer.arrow_forward
- The Distribution and Chi Square Test of Sexes in Families of Four Children D/E Observed number Expected number of families (0) Combination Deviation (d) of families All boys (b 3 boys & 1 girl (b3 g) 2 boys & 2 girls (b'g) 1 boys & 3 girls (bg³) All girls (g*) ТОTAL: Computed chi square value: Tabular chi square value : df and at 0.05 level of significance Decisionarrow_forwardA nutritionist is interested in collecting data to develop a healthy eating program at a local high school. In particular, the nutritionist is interested in collecting the students' body mass index value and their daily caloric intake. The nutritionist wishes to study the relationship between these two quantitative pieces of data. What would be the best graph to display this type of data? A B с D scatterplot histogram box plot pie chartarrow_forwardPlease answer these two questions.arrow_forward
 Human Heredity: Principles and Issues (MindTap Co...BiologyISBN:9781305251052Author:Michael CummingsPublisher:Cengage Learning
 Comprehensive Medical Assisting: Administrative a...NursingISBN:9781305964792Author:Wilburta Q. Lindh, Carol D. Tamparo, Barbara M. Dahl, Julie Morris, Cindy CorreaPublisher:Cengage Learning