
Concept explainers
Videos
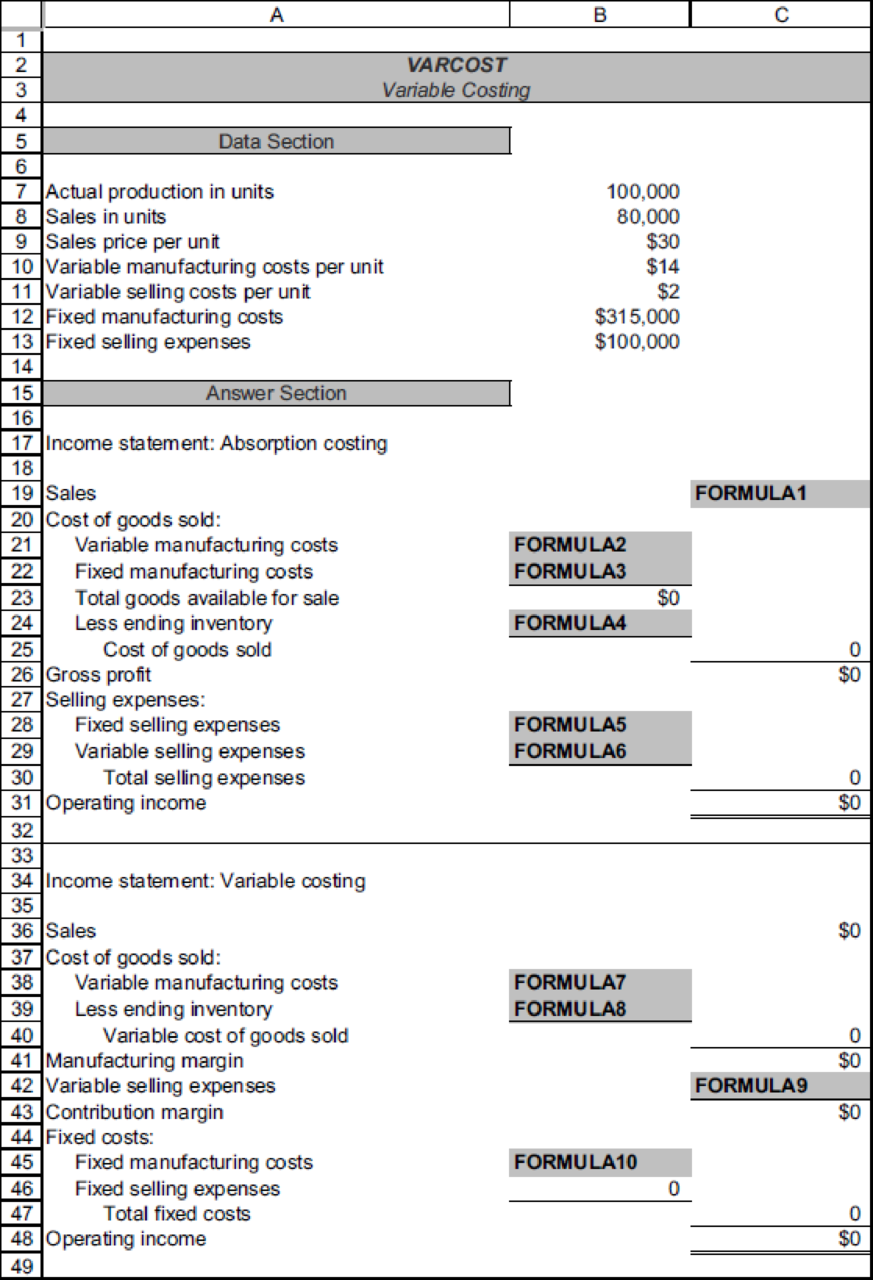
Click the Chart sheet tab. This chart is based on the problem data and the two income statements. Answer the following questions about the chart:
- a. What is the title for the X-axis?
- b. What is the title for the Y-axis?
- c. What does data range A represent?
- d. What does data range B represent?
- e. Why do the two data ranges cross?
- f. What would be a good title for this chart?
When the assignment is complete, close the file without saving it again.
Worksheet. The VARCOST2 worksheet is capable of calculating variable and absorption income when unit sales are equal to or less than production. An equally common situation (that this worksheet cannot handle) is when beginning inventory is present and sales volume exceeds production volume. Revise the worksheet Data Section to include:
Also, change actual production to 70,000.
Revise the Answer Section to accommodate this new data. Assume that Anderjak uses the weighted-average costing method for inventory. Preview the printout to make sure that the worksheet will print neatly on one page, and then print the worksheet. Save the completed file as VARCOSTT. Check figure: Absorption income, $670,000.
Chart. Using the VARCOST2 file, fix up the chart used in requirement 5 by adding appropriate titles and legends and formatting the X- and Y-axes. Enter your name somewhere on the chart. Save the file again as VARCOST2. Print the chart.
Want to see the full answer?
Check out a sample textbook solution
Chapter 19 Solutions
Excel Applications for Accounting Principles


- Need help with Operating income. What is the formula using the data in the pictures.arrow_forwardUsing the following statement above, use Horizontal Analysis and analyze the data that are given above.arrow_forwardUsing functions , complete the “Aggregated Data” worksheet using the “Statementof Income” worksheet.arrow_forward
- Answer the questions based on the Data Table.arrow_forwardI need help with this one. Please provide the missing amounts and do the vertical analysis.arrow_forwardA single-step income statement follows. Present the information in a multistep income statement, and indicate what insights can be obtained from the multistep form as opposed to the single-step form.arrow_forward
- White has a reportable segment if the segment’s revenue will total to what amount?arrow_forwardBased on the given data, answer the two questions. Show your solutions.arrow_forwardComplete the following table by entering either debit orcredit in each cell:Item Increase DecreaseRevenuesExpensesarrow_forward
 Excel Applications for Accounting PrinciplesAccountingISBN:9781111581565Author:Gaylord N. SmithPublisher:Cengage Learning