
a)
The question requires us to draw a laffer curve and determine the dependent variable, the independent variable, the axis which measures the income tax rate, and the axis which measures the tax revenue.
a)
Explanation of Solution
The following graph represents the Laffer curve:
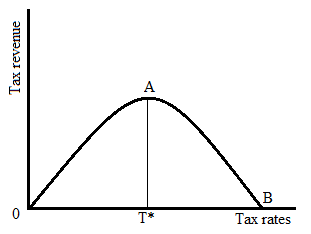
Laffer curve is an inverted u-shaped curve that represents the relationship between the tax rate and tax revenue in an economy. In the above graph, T* is the efficient tax rate at which tax revenue is maximized. To the left of T*, an increase in tax rate will increase the tax revenue. So, to the left of T*, the slope of the Laffer curve is positive.
To the right of T*, an increase in tax rate will decrease the tax revenue. So, to the right of T*, the slope of the Laffer curve is negative.
Here,
- The dependent variable is tax revenue because it is based on the tax rate.
- The independent variable is the tax rate.
- The x-axis represents the income tax rate.
- The y-axis represents the income tax revenue.
b)
The question requires us to determine the tax revenue at a 0% tax rate.
b)
Explanation of Solution
From the graph in part “a”,
When the income tax rate is 0%, the tax revenue will be zero.
c)
The question requires us to determine the tax revenue at a 100% tax rate.
c)
Explanation of Solution
At point B, in the graph given in part “a”,
Tax revenue is zero when the income tax rate is 100%.
d)
The question requires us to determine the relationship between tax rate and tax revenue when the tax rate is below 80% and above 80%.
d)
Explanation of Solution
Given, the efficient tax rate is 80% at which tax revenue is maximized.
T* = 80%
When the tax rate is below 80%, an increase in tax rate will increase the tax revenue and thus showing the positive relationship between tax rate and tax revenue.
When the tax rate is above 80%, an increase in tax rate will decrease the tax revenue and thus showing the negative relationship between tax rate and tax revenue.
Chapter 1A Solutions
Krugman's Economics For The Ap® Course


 Principles of Economics (12th Edition)EconomicsISBN:9780134078779Author:Karl E. Case, Ray C. Fair, Sharon E. OsterPublisher:PEARSON
 Engineering Economy (17th Edition)EconomicsISBN:9780134870069Author:William G. Sullivan, Elin M. Wicks, C. Patrick KoellingPublisher:PEARSON
 Principles of Economics (MindTap Course List)EconomicsISBN:9781305585126Author:N. Gregory MankiwPublisher:Cengage Learning
 Managerial Economics: A Problem Solving ApproachEconomicsISBN:9781337106665Author:Luke M. Froeb, Brian T. McCann, Michael R. Ward, Mike ShorPublisher:Cengage Learning
 Managerial Economics & Business Strategy (Mcgraw-...EconomicsISBN:9781259290619Author:Michael Baye, Jeff PrincePublisher:McGraw-Hill Education