ECONOMICS-W/MYECONLAB
7th Edition
ISBN: 9780134833125
Author: Hubbard
Publisher: PEARSON
expand_more
expand_more
format_list_bulleted
Videos
Textbook Question
Chapter 1.A, Problem 6PA
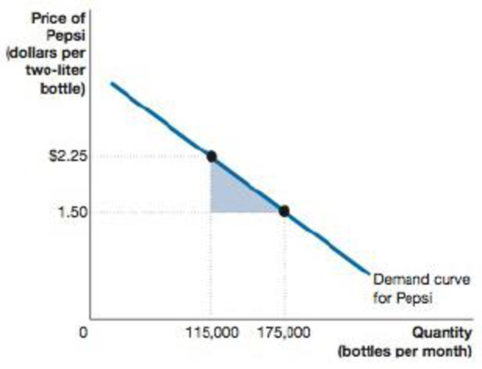
What is the area of the triangle shown in the following figure?
Expert Solution & Answer
Want to see the full answer?
Check out a sample textbook solution
Students have asked these similar questions
Can you do an explanation for this graph please soon as possible.
can i get these both solved with a graph please
Could you answer question b) which is to draw the graph?
Chapter 1 Solutions
ECONOMICS-W/MYECONLAB
Ch. 1.A - Prob. 1PACh. 1.A - Prob. 2PACh. 1.A - Prob. 3PACh. 1.A - Prob. 4PACh. 1.A - Prob. 5PACh. 1.A - What is the area of the triangle shown in the...Ch. 1.A - Prob. 7PACh. 1 - Prob. 1TCCh. 1 - Prob. 2TCCh. 1 - Prob. 1.1.1RQ
Ch. 1 - Prob. 1.1.2RQCh. 1 - Prob. 1.1.3PACh. 1 - Prob. 1.1.4PACh. 1 - Prob. 1.1.5PACh. 1 - Prob. 1.1.6PACh. 1 - Prob. 1.1.7PACh. 1 - Prob. 1.1.8PACh. 1 - Prob. 1.1.9PACh. 1 - Prob. 1.1.10PACh. 1 - Prob. 1.1.11PACh. 1 - Prob. 1.2.1RQCh. 1 - Prob. 1.2.2RQCh. 1 - Prob. 1.2.3RQCh. 1 - Prob. 1.2.4RQCh. 1 - Prob. 1.2.5PACh. 1 - Prob. 1.2.6PACh. 1 - Prob. 1.2.7PACh. 1 - Prob. 1.2.8PACh. 1 - Prob. 1.2.9PACh. 1 - Prob. 1.2.10PACh. 1 - Prob. 1.2.11PACh. 1 - Prob. 1.2.12PACh. 1 - Prob. 1.2.13PACh. 1 - Prob. 1.3.1RQCh. 1 - Prob. 1.3.2RQCh. 1 - Prob. 1.3.3RQCh. 1 - Prob. 1.3.4PACh. 1 - Prob. 1.3.5PACh. 1 - Prob. 1.3.6PACh. 1 - Prob. 1.3.7PACh. 1 - Prob. 1.3.8PACh. 1 - Prob. 1.3.9PACh. 1 - Prob. 1.3.10PACh. 1 - Prob. 1.3.11PACh. 1 - Prob. 1.4.1RQCh. 1 - Prob. 1.4.2RQCh. 1 - Prob. 1.4.3PACh. 1 - Prob. 1.4.4PACh. 1 - Prob. 1.1CTECh. 1 - Prob. 1.2CTE
Knowledge Booster


Learn more about
Need a deep-dive on the concept behind this application? Look no further. Learn more about this topic, economics and related others by exploring similar questions and additional content below.Similar questions
- Describe this graph in words and in terms of the fisher effectarrow_forwardFootball weights The Sears Cup was established in 1993to honor institutions that maintain a broad-based athleticprogram, achieving success in many sports, both men’sand women’s. Since its Division III inception in 1995, thecup has been won by Williams College in every yearexcept one. Their football team has a 85.3% winningrecord under their current coach. Why does the footballteam win so much? Is it because they’re heavier thantheir opponents? The table shows the average teamweights for selected years from 1973 to 1993.a) Fit a straight line to the relationship between Weightand Year.b) Does a straight line seem reasonable?c) Predict the average weight of the team for the year2003. Does this seem reasonable?d) What about the prediction for the year 2103? Explain.e) What about the prediction for the year 3003? Explain. Year Weight (lb) Year Weight (lb)1973 185.5 1983 192.01975 182.4 1987 196.91977 182.1 1989 202.91979 191.1 1991 206.01981 189.4 1993 198.7arrow_forwardA supple curve for which of the following products would likely be the most inelastic? a. Car b. A glass of lemonade c. A radio d. a pair of jeansarrow_forward
- The following graph shows the annual market for Florida oranges, which are sold in units of 90-pound boxes. Use the graph input tool to help you answer the following questions. You will not be graded on any changes you make to this graph. Note: Once you enter a value in a white field, the graph and any corresponding amounts in each grey field will change accordingly. 07014021028035042049056063070050454035302520151050PRICE (Dollars per box)QUANTITY (Millions of boxes)Demand Supply Graph Input Tool Market for Florida Oranges Price (Dollars per box) Quantity Demanded (Millions of boxes) Quantity Supplied (Millions of boxes) In this market, the equilibrium price is per box, and the equilibrium quantity of oranges is million boxes. For each of the prices listed in the following table, determine the quantity of oranges demanded, the quantity of oranges supplied, and the direction of pressure exerted on prices…arrow_forwardWhat is the difference between the income consumption curve and the Engel curve?arrow_forward1. Gorgeousleny with an income of P150 would like to buy two goods. Let us say juice and bread. Price of juice is P12 and price of bread is P6. If gorgeousleny will buy the ist 5 juices she is entitled to a 50% off. Draw the graph. After a week gorgeousleny went back to the store and will still buy her two favorite goods with the same income of P150 and price of bread and juice is constant. but this time the promo of 50% off is applied after the ist 5 juices. Draw the graph. . a. ) Measure the qty. of bread on the vertical axis and the qty. of juice on the horizontal axis. Label both graph with its corresponding points, pt. A for bread and point B for juice. the combination of bread and juice label it as point C. b.) For both graph, What is the slope from point C to point B? ; What is the slope from from point A to point C?arrow_forward
- part 2 of ( b)Use this table to find the area under the standard normal curve to the left of z=−0.50 Give your answer to four decimal places (for example, 0.1234).arrow_forwardCan you help me to draw a graph for question 5 please? Thanksarrow_forwardI don't know how to draw that graph and about those changes..Will u please help me to solve that issue?arrow_forward
arrow_back_ios
SEE MORE QUESTIONS
arrow_forward_ios
Recommended textbooks for you
 Microeconomics: Principles & PolicyEconomicsISBN:9781337794992Author:William J. Baumol, Alan S. Blinder, John L. SolowPublisher:Cengage Learning
Microeconomics: Principles & Policy
Economics
ISBN:9781337794992
Author:William J. Baumol, Alan S. Blinder, John L. Solow
Publisher:Cengage Learning
Forecasting: Exponential Smoothing, MSE; Author: Joshua Emmanuel;https://www.youtube.com/watch?v=k_HN0wOKDd0;License: Standard Youtube License