Concept explainers
Videos
Figure Q2.10 shows an object's position-versus-time graph. The letters A to E correspond to various segments of the motion in which the graph has constant slope.
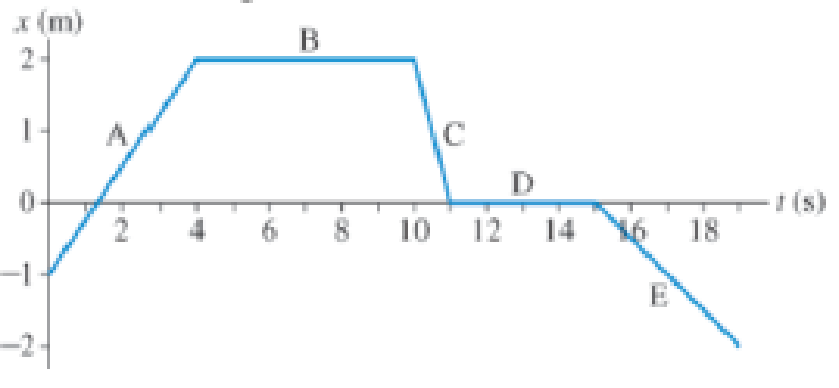
Figure Q2.10
a. Write a realistic motion short story for an object that would have this position graph.
b. In which segment(s) is the object at rest?
c. In which segment(s) is the object moving to the right?
d. Is the speed of the object during segment C greater than, equal to, or less than its speed during segment E? Explain.
Want to see the full answer?
Check out a sample textbook solution
Chapter 2 Solutions
College Physics: A Strategic Approach Technology Update, Books a la Carte Plus Mastering Physics with Pearson eText -- Access Card Package (3rd Edition)
Additional Science Textbook Solutions
The Cosmic Perspective
University Physics Volume 1
Modern Physics
Conceptual Integrated Science
Essential University Physics (3rd Edition)


- An object that moves in one dimension has the velocity-versus-time graph shown in Figure P2.52. At time t = 0, the object has position x = 0. a. At time t = 5 s. is the acceleration of the object positive, negative, or zero? Explain. b. At time t = 8 s, is the object speeding up, showing down, or moving with constant speed? Explain. c. Write an expression for the position of the object as a function of time. Explain how you use the graph to obtain your answer. d. Use your expression from part (c) to determine the time (if any) at which the object reaches its maximum position. Check your results by examining the graph. Hint: To get started with finding the maximum of a function, take the derivative and set it equal to zero.arrow_forwardA student drives a moped along a straight road as described by the velocitytime graph in Figure P2.32. Sketch this graph in the middle of a sheet of graph paper. (a) Directly above your graph, sketch a graph of the position versus time, aligning the time coordinates of the two graphs. (b) Sketch a graph of the acceleration versus time directly below the velocitytime graph, again aligning the time coordinates. On each graph, show the numerical values of x and ax for all points of inflection. (c) What is the acceleration at t = 6.00 s? (d) Find the position (relative to the starting point) at t = 6.00 s. (e) What is the mopeds final position at t = 9.00 s? Figure P2.32arrow_forwardThe Acela is an electric train on the Washington-New YorkBoston run, carrying passengers at 170 mi/h. A velocity-time graph for the Acela is shown in Figure P2.69. (a) Describe the train's motion in each successive lime interval, (b) Find the trains peak positive acceleration in the motion graphed, (c) Find the trains displacement in miles between t = 0 and t = 200 s.arrow_forward
- (a) Explain how you can determine the acceleration over time from a velocity versus time graph such as the one in Figure 2.56. (b) Based on the graph, how does acceleration change over time?arrow_forwardAn Olympic-class sprinter starts a race with an acceleration of 4.50 m/s2. (a) What is her speed 2.40 s later? (b) Sketch a graph of her position vs. time for this period.arrow_forwardA glider of length moves through a stationary photogate on an air track. A photogate (Fig. P2.19) is a device that measures the time interval td during which the glider blocks a beam of infrared light passing across the photogate. The ratio vd = /td is the average velocity of the glider over this part of its motion. Suppose the glider moves with constant acceleration. (a) Argue for or against the idea that vd is equal to the instantaneous velocity of the glider when it is halfway through the photogate in space. (b) Argue for or against the idea that vd is equal to the instantaneous velocity of the glider when it is halfway through the photogate in time. Figure P2.19arrow_forward
- The Acela is an electric train on the WashingtonNew YorkBoston run, carrying passengers at 170 mi/h. A velocitytime graph for the Acela is shown in Figure P2.46. (a) Describe the trains motion in each successive time interval. (b) Find the trains peak positive acceleration in the motion graphed. (c) Find the trains displacement in miles between t = 0 and t = 200 s. Figure P2.46 Velocity versus time graph for the Acela.arrow_forwardA speedboat travels in a straight line and increases in speed uniformly from i = 20.0 m/s to f = 30.0 m/s in displacement x of 200 m. We wish to find the time interval required for the boat to move through this displacement, (a) Draw a coordinate system for this situation, (b) What analysis model is most appropriate for describing this situation? (c) From the analysis model, what equation is most appropriate for finding the acceleration of the speedboat? (d) Solve the equation selected in part (c) symbolically for the boats acceleration in terms of i, f, and x. (e) Substitute numerical values lo obtain the acceleration numerically. (f) Find the time interval mentioned above.arrow_forwardKathy tests her new sports car by racing with Sian, an experienced racer. Both start from rest, but Kathy leaves the starting line 1.00 s after Stan does. Stan moves with a constant acceleration of 3.50 m/s2, while Kathy maintains an acceleration of 4.90 m/s2. Find (a) the time at which Kathy overtakes Stan, (b) the distance she travels before she catches him, and (c) the speeds of both cars at the instant Kathy overtakes Stan.arrow_forward
- A motorist drives for 35.0 minutes at 85.0 km/h and then stops for 15.0 minutes. He then continues north, traveling 130. Km in 2.00 h. (a) What is his total displacement? (b) What is his average velocity?arrow_forwardA motorist drives for 35.0 minutes at 85.0 km/h and then stops for 15.0 minutes. He then continues north, traveling 130. Km in 2.00 h. (a) What is his total displacement? (b) What is his average velocity?arrow_forwardA bicycle racer sprints at the end of a race to clinch a victory. The racer has an initial velocity of 11.5 m/s and accelerates at the rate of 0.500 m/s2 for 7.00 s. (a) What is his final velocity? (b) The racer continues at this velocity to the finish line. If he was 300 m from the finish line when he started to accelerate, how much time did he save? (c) One other racer was 5.00 m ahead when the winner started to accelerate, but he was unable to accelerate, and traveled at 11.8 m/s until the finish line. How far ahead of him (in meters and in seconds) did the winner finish?arrow_forward
 Glencoe Physics: Principles and Problems, Student...PhysicsISBN:9780078807213Author:Paul W. ZitzewitzPublisher:Glencoe/McGraw-Hill
 Physics for Scientists and Engineers: Foundations...PhysicsISBN:9781133939146Author:Katz, Debora M.Publisher:Cengage Learning
 Physics for Scientists and Engineers, Technology ...PhysicsISBN:9781305116399Author:Raymond A. Serway, John W. JewettPublisher:Cengage Learning
 College PhysicsPhysicsISBN:9781938168000Author:Paul Peter Urone, Roger HinrichsPublisher:OpenStax College
 Principles of Physics: A Calculus-Based TextPhysicsISBN:9781133104261Author:Raymond A. Serway, John W. JewettPublisher:Cengage Learning