
Fundamentals of Biostatistics
8th Edition
ISBN: 9781305268920
Author: Bernard Rosner
Publisher: Cengage Learning
expand_more
expand_more
format_list_bulleted
Concept explainers
Videos
Textbook Question
Chapter 2, Problem 10P
A man runs 1 mile approximately once per weekend. He records his time over an 18-week period. The individual times and summary statistics are given in Table 2.14.
Table 2.14 One mile running time for an individual, over 18 weeks
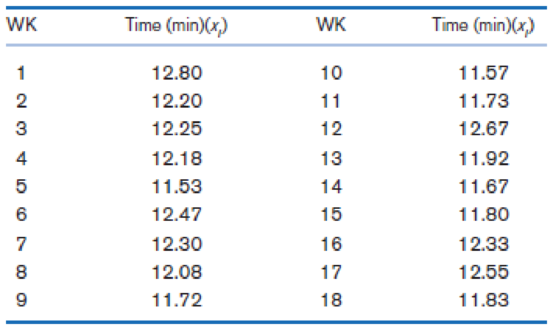
Suppose we construct a new variable called time_100 = 100 × time (e.g., for week 1, time_100 = 1280).
What is the mean and standard deviation of time_100?
Expert Solution & Answer
Want to see the full answer?
Check out a sample textbook solution
Students have asked these similar questions
King Tut was an ancient Egyptian ruler whose tomb was discovered and opened in 1923. Legend has it that the archaeologists who opened the tomb were subject to a "mummy's curse," which would shorten their life spans. A team of scientists conducted an investigation of the mummy's curse. They reported that the 27 people exposed to the curse had a mean life span of 71.3 years with a standard deviation of 12.2 years, while a sample of 13 Westerners in Egypt at the time who were not exposed to the curse had a mean life span of 78.5 years with a standard deviation of 14.5 years. Assume that the populations are approximately normal. Can you conclude that the mean life span of those exposed to the mummy's curse is less than the mean life span of those not exposed? Let m1 denote the mean life span of those exposed to the mummy's curse and m2 denote the mean life span of those not exposed. Use the a=0.10 level and the p-value method with the TI-84 Plus calculator.
King Tut was an ancient Egyptian ruler whose tomb was discovered and opened in
1923
. Legend has it that the archaeologists who opened the tomb were subject to a "mummy's curse," which would shorten their life spans. A team of scientists conducted an investigation of the mummy's curse. They reported that the
24
people exposed to the curse had a mean life span of
71.1
years with a standard deviation of
11.6
years, while a sample of
12
Westerners in Egypt at the time who were not exposed to the curse had a mean life span of
77.7
years with a standard deviation of
13.9
years. Assume that the populations are approximately normal. Can you conclude that the mean life span of those exposed to the mummy's curse differs from the mean life span of those not exposed? Let
μ1
denote the mean life span of those exposed to the mummy's curse and
μ2
denote the mean life span of those not exposed. Use the
=α0.01
level and the
P
-value method with the TI-84 Plus calculator.
do we…
According to a report published by the USDA 4 years ago, a typical American consumes an average of 6.66 pounds of potato chips per year.A researcher at the USDA would like to determine if the average amount of potato chips consumed each year by a typical American has changed since the original report was published. The researcher collected data from a random sample of 31 Americans and found that the mean amount of potato chips consumed each year by the sample was 6.37 pounds with a standard deviation of 0.603 pounds.Using α=0.05α=0.05, test the hypothesis that the mean amount of potato chips consumed each year by a typical American is different than 6.66 pounds. Use the p-value method.
Determine the test statistic for the hypothesis test. Round the solution to four decimal places.Determine the p-value (range) for the hypothesis test.
p-value < 0.001
0.001 < p-value < 0.01
0.01 < p-value < 0.02
0.02 < p-value < 0.05
0.05 < p-value < 0.10
0.10 < p-value…
Chapter 2 Solutions
Fundamentals of Biostatistics
Ch. 2.6 - When is it appropriate to use the arithmetic mean...Ch. 2.6 - How does the geometric mean differ from the...Ch. 2.6 - What is the difference between the standard...Ch. 2.8 - What is a stem-and-leaf plot? How does it differ...Ch. 2.8 - Prob. B.2RECh. 2.8 - Consider the stem-and-leaf plot in Figure 2.6. Is...Ch. 2.8 - What is a box plot? What additional information...Ch. 2 - The data in Table 2.13 are a sample from a larger...Ch. 2 - The data in Table 2.13 are a sample from a larger...Ch. 2 - It is of clinical interest to know if the duration...
Ch. 2 - Suppose the scale for a data set is changed by...Ch. 2 - Suppose the scale for a data set is changed by...Ch. 2 - Suppose the scale for a data set is changed by...Ch. 2 - Suppose the scale for a data set is changed by...Ch. 2 - A man runs 1 mile approximately once per weekend....Ch. 2 - A man runs 1 mile approximately once per weekend....Ch. 2 - A man runs 1 mile approximately once per weekend....Ch. 2 - A man runs 1 mile approximately once per weekend....Ch. 2 - A man runs 1 mile approximately once per weekend....Ch. 2 - The data in Table 2.15 are a sample of cholesterol...Ch. 2 - The data in Table 2.15 are a sample of cholesterol...Ch. 2 - The data in Table 2.15 are a sample of cholesterol...Ch. 2 - The data in Table 2.15 are a sample of cholesterol...Ch. 2 - The data in Table 2.15 are a sample of cholesterol...Ch. 2 - In an experiment that examined the effect of body...Ch. 2 - In an experiment that examined the effect of body...Ch. 2 - Table 2.17 Format for FEV.DAT The data in Table...Ch. 2 - Forced expiratory volume (FEV) is an index of...Ch. 2 - Forced expiratory volume (FEV) is an index of...Ch. 2 - Prob. 26PCh. 2 - The food-frequency questionnaire (FFQ) is an...Ch. 2 - In Section 2.9, we described Data Set LEAD.DAT (at...Ch. 2 - In Section 2.9, we described Data Set LEAD.DAT (at...Ch. 2 - Activated-protein-C (APC) resistance is a serum...Ch. 2 - Activated-protein-C (APC) resistance is a serum...Ch. 2 - A study was conducted to demonstrate that soy...Ch. 2 - A study was conducted to demonstrate that soy...Ch. 2 - A study was conducted to demonstrate that soy...Ch. 2 - Prob. 38PCh. 2 - In Section 2.10, we described Data Set BONEDEN.DAT...Ch. 2 - What impression do you have of the relationship...Ch. 2 - In Section 2.10, we described Data Set BONEDEN.DAT...Ch. 2 - In Section 2.10, we described Data Set BONEDEN.DAT...Ch. 2 - Prob. 43PCh. 2 - Prob. 44PCh. 2 - Prob. 45PCh. 2 - Answer Problems 2.382.40 for BMD for the femoral...Ch. 2 - The Left Ventricular Mass lndex (LVMI) is a...Ch. 2 - Prob. 48PCh. 2 - Prob. 49PCh. 2 - The Left Ventricular Mass lndex (LVMI) is a...
Knowledge Booster


Learn more about
Need a deep-dive on the concept behind this application? Look no further. Learn more about this topic, statistics and related others by exploring similar questions and additional content below.Similar questions
- The patient recovery time from a particular surgical procedure is normallu distrubuted with a mean of 5.3 and a standard deviation of 2.1 days. what is the median recovery time? what is the z-score for a patient who takes ten days to recover?arrow_forwardThe time it takes for a grade 11 students to complete a physical test is normally distributed with a mean of 15 minutes and a standard deviation of 4 minutes. If the students who gets the fastest 5% completion times will be exempted from the additional workout gym session, what is the slowest time that a student can have to qualify from exemption?arrow_forwardThe time spent waiting for a kidney transplant is distributed normally with a mean of 1674 days and a standard deviation of 212.5 days. What waiting time represents the first quartile?arrow_forward
- A person’s IQ must be in the upper 2% of the population to be considered into the Honor Society. If the mean score is 100 and the standard deviation is 15, what score must a person have to qualify for the Honor Society?arrow_forwardA recent study showed that the modern working person experiences an average of 2.1 hours per day of distractions( phone calls, e-mails, impromptu visits,etc.). A random sample of 50 workers for a large corporation found that these workers were distracted an average of 1.8 hours per day and the population standard deviation was 20 minutes. Estimate the true mean population distraction time with 90% confidence, and compare your answer to the results of the studyarrow_forwardA professor in the women’s studies program believes that the amount of smoking by women has increased in recent years. A complete census taken 2 years ago of women living in a neighbourng city showed that the mean number of cigarettes smoked daily by the women was 5.0 with a standard deviation of 2.2. To assess her belief, the professor determined the daily smoking rate of random sample of 121 women currently living in that city. The data show that the number of cigarettes smoked daily by the 121 women has a mean of 6.1 and a standard deviation of 2.7. Is the professor’s belief correct? Assume a directional alternative hypothesis is appropriate and use an alpha = to 0.051-tailed in making your decision. Be sure that the most sensitive test is used to analyze the data. Assume the population standard deviation is unknown and reanalyze the data using the same alpha level. What is your conclusion this time? Determine the size of effect found in part b and provide an interpretation…arrow_forward
- Do male college students spend more time studying than female college students? This was one of the questions investigated by the authors of an article. Each student in a random sample of 46 male students at a university in England and each student in a random sample of 38 female students from the same university kept a diary of how he or she spent time over a 3-week period. For the sample of males, the mean time spent studying per day was 282.0 minutes and the standard deviation was 160.4 minutes. For the sample of females, the mean time spent studying was 181.8 minutes and the standard deviation was 166.4 minutes. Is there convincing evidence that the mean time male students at this university spend studying is greater than the mean time for female students? Test the appropriate hypotheses using ? = 0.05. (Use ?1 for male students and ?2 for female students.) State the appropriate null and alternative hypotheses. Find the test statistic and P-value. (Use a table or SALT. Round your…arrow_forwardThanks to an initiative to recruit top students, an administrator at a college claims that this year's entering class must have a greater mean IQ score than that of entering classes from previous years. The administrator tests a random sample of 17 of this year's entering students and finds that their mean IQ score is 112, with a standard deviation of 15. The college records indicate that the mean IQ score for entering students from previous years is 111. Is there enough evidence to conclude, at the 0.10 level of significance, that the population mean IQ score, μ, of this year's class is greater than that of previous years? To answer, assume that the IQ scores of this year's entering class are approximately normally distributed. Perform a one-tailed test. Then complete the parts below. Carry your intermediate computations to three or more decimal places. (If necessary, consult a list of formulas.) (a) State the null hypothesis H0 and the alternative hypothesis H1. H0:…arrow_forwardThanks to an initiative to recruit top students, an administrator at a college claims that this year's entering class must have a greater mean IQ score than that of entering classes from previous years. The administrator tests a random sample of 16 of this year's entering students and finds that their mean IQ score is 116 , with a standard deviation of 9 . The college records indicate that the mean IQ score for entering students from previous years is 114 . Is there enough evidence to conclude, at the 0.05 level of significance, that the population mean IQ score, μ , of this year's class is greater than that of previous years? To answer, assume that the IQ scores of this year's entering class are approximately normally distributed. Perform a one-tailed test. Then complete the parts below. Carry your intermediate computations to three or more decimal places. (If necessary, consult a list of formulas.) (a) State the null hypothesis H0 and the alternative…arrow_forward
- Thanks to an initiative to recruit top students, an administrator at a college claims that this year's entering class must have a greater mean IQ score than that of entering classes from previous years. The administrator tests a random sample of 18 of this year's entering students and finds that their mean IQ score is 120, with a standard deviation of 9. The college records indicate that the mean IQ score for entering students from previous years is 115. Is there enough evidence to conclude, at the 0.10 level of significance, that the population mean IQ score, μ, of this year's class is greater than that of previous years? To answer, assume that the IQ scores of this year's entering class are approximately normally distributed. Perform a one-tailed test. Then complete the parts below. Carry your intermediate computations to three or more decimal places. a. State the null hypothesis H0 and the alternative hypothesis H1. b. Find the value of the tes statistic. Round to three or more…arrow_forwardThanks to an initiative to recruit top students, an administrator at a college claims that this year's entering class must have a greater mean IQ score than that of entering classes from previous years. The administrator tests a random sample of 15 of this year's entering students and finds that their mean IQ score is 118, with a standard deviation of 14. The college records indicate that the mean IQ score for entering students from previous years is 114. Is there enough evidence to conclude, at the 0.05 level of significance, that the population mean IQ score, μ, of this year's class is greater than that of previous years? To answer, assume that the IQ scores of this year's entering class are approximately normally distributed. Perform a one-tailed test. Then complete the parts below. Carry your intermediate computations to three or more decimal places. A. Find the value of the test statistic and round to 3 or more decimal places. (I have posted a picture of an example problem and the…arrow_forwardThanks to an initiative to recruit top students, an administrator at a college claims that this year's entering class must have a greater mean IQ score than that of entering classes from previous years. The administrator tests a random sample of 15 of this year's entering students and finds that their mean IQ score is 118, with a standard deviation of 14. The college records indicate that the mean IQ score for entering students from previous years is 114. Is there enough evidence to conclude, at the 0.05 level of significance, that the population mean IQ score, μ, of this year's class is greater than that of previous years? To answer, assume that the IQ scores of this year's entering class are approximately normally distributed. Perform a one-tailed test. Then complete the parts below. Carry your intermediate computations to three or more decimal places. A. Find the value of the test statistic and round to 3 or more decimal places. (I have posted a picture of an example problem and…arrow_forward
arrow_back_ios
SEE MORE QUESTIONS
arrow_forward_ios
Recommended textbooks for you
 Glencoe Algebra 1, Student Edition, 9780079039897...AlgebraISBN:9780079039897Author:CarterPublisher:McGraw Hill
Glencoe Algebra 1, Student Edition, 9780079039897...
Algebra
ISBN:9780079039897
Author:Carter
Publisher:McGraw Hill
The Shape of Data: Distributions: Crash Course Statistics #7; Author: CrashCourse;https://www.youtube.com/watch?v=bPFNxD3Yg6U;License: Standard YouTube License, CC-BY
Shape, Center, and Spread - Module 20.2 (Part 1); Author: Mrmathblog;https://www.youtube.com/watch?v=COaid7O_Gag;License: Standard YouTube License, CC-BY
Shape, Center and Spread; Author: Emily Murdock;https://www.youtube.com/watch?v=_YyW0DSCzpM;License: Standard Youtube License