
Concept explainers
Videos
A man runs 1 mile approximately once per weekend. He records his time over an 18-week period. The individual times and summary statistics are given in Table 2.14.
Table 2.14 One mile running time for an individual, over 18 weeks
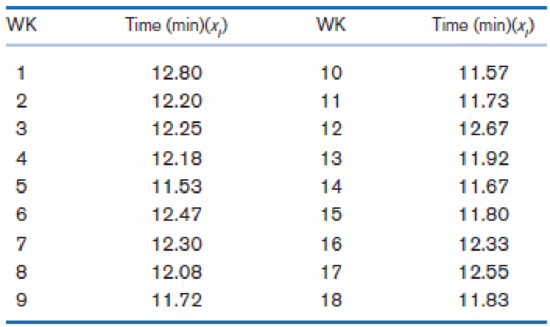
Suppose we construct a new variable called time_100 = 100 × time (e.g., for week 1, time_100 = 1280).
Suppose the man does not run for 6 months over the winter due to snow on the ground. He resumes running once a week in the spring and records a running time = 12.97 minutes in his first week of running in the spring.
Is this an outlying value relative to the distribution of running times recorded the previous year in Table 2.14? Why or why not?
Hint: Construct a Box plot based on the data in Table 2.14, and assess whether this new point is an outlier based on Definition 2.11.

Trending nowThis is a popular solution!

Chapter 2 Solutions
Fundamentals of Biostatistics


- According to a los angeles times study of more than 1 million medical dispatches from2007 to 2012, the 911 response time for medical aid varies dramatically across LosAngeles (la times website, November 2012). Under national standards adopted by theLos Angeles Fire Department, rescuers are supposed to arrive within six minutes to almostall medical emergencies. But the times analysis found that in affluent hillside communities stretching from griffith Park to Pacific Palisades, firefighters failed to hit that marknearly 85% of the time.The following data show the response times, in minutes, for 10 emergency calls in thegriffith Park neighborhood.11.8 10.3 10.7 10.6 11.5 8.3 10.5 10.9 10.7 11.2Based on this sample of ten response times, compute the descriptive statistics in parts (a)and (b) and then answer the questions in parts (c) and (d):a. Mean, median, and modearrow_forwardAccording to a los angeles times study of more than 1 million medical dispatches from2007 to 2012, the 911 response time for medical aid varies dramatically across LosAngeles (la times website, November 2012). Under national standards adopted by theLos Angeles Fire Department, rescuers are supposed to arrive within six minutes to almostall medical emergencies. But the times analysis found that in affluent hillside communities stretching from griffith Park to Pacific Palisades, firefighters failed to hit that marknearly 85% of the time.The following data show the response times, in minutes, for 10 emergency calls in thegriffith Park neighborhood.11.8 10.3 10.7 10.6 11.5 8.3 10.5 10.9 10.7 11.2Based on this sample of ten response times, compute the descriptive statistics in parts (a)and (b) and then answer the questions in parts (c) and (d):a. Mean, median, and modeb. Range and standard deviationc. Should the response time of 8.3 minutes be considered an outlier in comparison to theother…arrow_forwardA child dying from an accidental poisoning is a terrible incident. Is it more likely that a male child will get into poison than a female child? To find this out, data was collected that showed that out of 1830 children between the ages one and four who pass away from poisoning, 1031 were males and 799 were females. Do the data show that there are more male children dying of poisoning than female children? Test at the 1% level.arrow_forward
- Suppose we have a panel data of of 100 firms over 20 years at a monthly frequency. We are interested in how firms’ bond ratings affect their investment. Give an example of an omitted variable that can be fixed by Fixed Effects or First Differences. Give another example of an omitted variable that cannot be fixed by Fixed Effects or First Differencesarrow_forwardOver the past 100 days, the price of a certain stock went up on 60 days and went down on 40 days. Explain why these data should not be used to test the claim that this stock price goes down on less than half of the days.arrow_forwardA child dying from an accidental poisoning is a terrible incident. Is it more likely that male child get into poison than a female child? To find this out, data was collected that showed that out of 1830 children between the ager and four who pass from poisoning, 1031 were males and 799 were females. Do the data show that there are more male children dying of poisoning than female children,Test at the 1% level?arrow_forward
- The world bank reports that one. 7% of the US population lives unless than two dollars per day. A policy maker claims that this number is misleading because of variations from state to state and rural to urban. To investigate that she takes a random sample of 100 households in Atlanta to compare with the national average and finds at two. One percent of the Atlanta population live on less than two dollars per day. Select the Noel an eternity of hypothesis to test weather Atlanta differ significantly from the national percentage.arrow_forwardIf a study determines the difference in average salary for sub population of people with blue eyes and people with brown eyes is not significant, then the population of blue eyed people are "blank" different salaries.arrow_forwardA government's department of transportation requires tire manufacturers to provide performance information on tire sidewalls to help prospective buyers make their purchasing decisions. One very important piece of information is the tread wear index, which indicates the tire's resistance to tread wear. A tire with a grade of 200 should last twice as long, on average, as a tire with a grade of 100. A consumer organization wants to test the actual tread wear index of a brand name of tires that claims "graded 200" on the sidewall of the tire. A random sample of n = 18 indicates a sample mean tread wear index of 195.6 and a sample standard deviation of 21.4arrow_forward
- A college professor reports that students who finish exams early (i.e., take the least amount of time to complete the exam) tend to get higher grades than students who hold on to exams until the last possible moment (i.e., take the most time to complete the exam). The correlation between exam scores and amount of time spent taking an exam is an example of….arrow_forwardBaseball has always been a favorite pastime in America and is rife with statistics and theories. In a paper, researchers showed that major league players who have nicknames live an average of 2½ years longer than those without them (The Wall Street Journal, July 16, 2009). You do not believe in this result and decide to collect data on the lifespan of 30 baseball players along with a nickname variable that equals 1 if the player had a nickname and 0 otherwise. The data are shown in the accompanying table and are contained in the accompanying Excel file. (You may find it useful to reference the appropriate table: z table or t table) Years Nickname Years Nickname Years Nickname 74 1 61 0 68 1 62 1 64 0 68 0 67 1 70 0 64 1 73 1 71 1 67 1 49 1 69 1 64 0 62 0 56 0 63 1 56 0 68 1 68 1 63 0 70 1 68 1 80 1 79 1 74 0 65 1 67 0 64 0 Click here for the Excel Data File Let Samples 1 and 2 represent…arrow_forwardThe international Human Genome Project yielded the DNA sequence of all 23 human chromosomes, each consisting of millions of nucleotides chained end to end. These encode the genes whose products-RNA and proteins-shape the growth and development of each individual. The length of each gene refers to the total number of nucleotides comprising the coding regions. A random sample of 100 human genes from the human genome was found to have a median length of 2640.5 nucleotides. Select the true statement(s) about the obtained median. A). The median gene length of all human genes is estimated to be 2640,5 nucleotides. B). A random sample of 1000 genes would likely yield an estimate of the median closer to the population median than a random sample of 100 genes. C). The sample median has a sampling distribution with a standard error. D) The median gene length of all human genes is 2640.5 nucleotides.arrow_forward
 MATLAB: An Introduction with ApplicationsStatisticsISBN:9781119256830Author:Amos GilatPublisher:John Wiley & Sons Inc
 Probability and Statistics for Engineering and th...StatisticsISBN:9781305251809Author:Jay L. DevorePublisher:Cengage Learning
 Statistics for The Behavioral Sciences (MindTap C...StatisticsISBN:9781305504912Author:Frederick J Gravetter, Larry B. WallnauPublisher:Cengage Learning
 Elementary Statistics: Picturing the World (7th E...StatisticsISBN:9780134683416Author:Ron Larson, Betsy FarberPublisher:PEARSON
 The Basic Practice of StatisticsStatisticsISBN:9781319042578Author:David S. Moore, William I. Notz, Michael A. FlignerPublisher:W. H. Freeman
 Introduction to the Practice of StatisticsStatisticsISBN:9781319013387Author:David S. Moore, George P. McCabe, Bruce A. CraigPublisher:W. H. Freeman