Answer:
Senator Long refers to point B on the graph as future production combination.
Explanation:
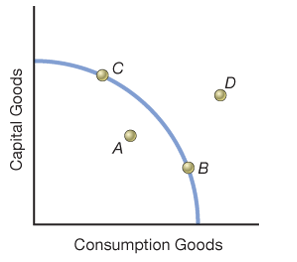
In the above diagram, Consumption goods are measured along x- axis and Capital goods are measured along y- axis.
For the given PPF, the points A, B, C and D diagram show the various production combinations of the Capital goods and Consumption goods shown on the two axis X and Y. The combination D is the most desirable of the production combinations with a higher number of units of both the Consumption and Capital goods. However, the combination D is unattainable given the resources or factors of production available for the production process. On the same lines of analysis, combination A is a suboptimal utilization of available resources. Combinations C and B are the points on the PPF showing the highest attainable production units among others with optimal resource utilization.
In the present context, Senator Long refers to point B on the graph as future production combination. This implies that within the resource constraint as defined by the PPF, a movement along the curve towards B shows an increased production of Consumption goods and less of Capital.
Want to see the full answer?
Check out a sample textbook solution
Chapter 2 Solutions
Economics Today: The Macro View (19th Edition) (Pearson Series in Economics)


 Principles of Economics (12th Edition)EconomicsISBN:9780134078779Author:Karl E. Case, Ray C. Fair, Sharon E. OsterPublisher:PEARSON
 Engineering Economy (17th Edition)EconomicsISBN:9780134870069Author:William G. Sullivan, Elin M. Wicks, C. Patrick KoellingPublisher:PEARSON
 Principles of Economics (MindTap Course List)EconomicsISBN:9781305585126Author:N. Gregory MankiwPublisher:Cengage Learning
 Managerial Economics: A Problem Solving ApproachEconomicsISBN:9781337106665Author:Luke M. Froeb, Brian T. McCann, Michael R. Ward, Mike ShorPublisher:Cengage Learning
 Managerial Economics & Business Strategy (Mcgraw-...EconomicsISBN:9781259290619Author:Michael Baye, Jeff PrincePublisher:McGraw-Hill Education