
Videos
Heaviside Function The Heaviside function
is widely used in engineering applications. (See figure.) To print an enlarged copy of the graph, go to
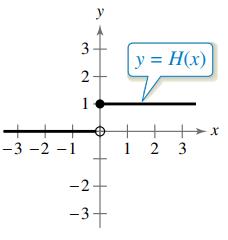
Sketch the graph of each function by hand.
Want to see the full answer?
Check out a sample textbook solution
Chapter 2 Solutions
College Algebra


- Fluid Flow The intake pipe of a 100-gallon tank has a flow rate of 10 gallons per minute, and two drainpipes have flow rates of 5 gallons per minute each. The figure shows the volume V of fluid in the tank as a function of time t. Determine whether the input pipe and each drainpipe are open or closed in specific subintervals of the 1 hour of time shown in the graph. (There are many correct answers.)arrow_forwardBungee Jumping Luisa goes bungee jumping from a 500-ft-high bridge. The graph shows Luisas height ht in ft after t seconds. Describe in words what the graph indicates about Luisas bungee jump. Suppose Luisa goes bungee jumping from a 400-ft-high bridge. Sketch a new graph that shows Luisas height Ht after t seconds. What transformation must be performed on the function h to obtain the function H? Express the function H in terms of h.arrow_forwardBird Population The graph shows the population of a rare species of bird, where t represents years since 2009 and n(t) is measured in thousands. a Find a function that models the bird population at time t in the form n(t)=n0ert. b What is the bird population expected to be in the year 2020?arrow_forward
- The Doppler Effect As a train moves toward an observer (see the figure), the pitch of its whistle sounds higher to the observer than it would if the train were at rest, because the crests Of the sound waves are closer together. 'This phenomenon is called the Doppler effect. The observed pitch P is a function of the speed v of the train and is given by P(v)=poSoSov where PO is the actual pitch of the whistle at the source and So = 332 rn/s is the speed of sound in air. Suppose that a train has a whistle pitched at Po = 440 Hz. the function y = P(v) using a graphing device. How can the vertical asymptote of this function be interpreted physically?arrow_forwardTemperature An object at a temperature of 160C was removed from a furnace and placed in a room at 20C. The temperature T of the object was measured each hour h and recorded in the table. A model for the data is T=20+140e0.68h (a)The figure below shows the graph of the model. Use the graph to identify the horizontal asymptote of the model and interpret the asymptote in the context of the problem. (b) Use the model to approximate the time it took for the object to reach a temperature of 100C.arrow_forwardStopping distance, The stopping distance of an automobile is the distance travelled during the driver’s reaction time plus the distance travelled after the driver applies the brakes. In an experiment, researchers measured these distances (in feet) when the automobile was traveling at a speed of x. miles per hour on dry, level pavement, as shown in the bar graph. The distance travelled during the reaction time R was R=1.1x and the braking distance B was B=0.0475x20.001x+0.23. (a) Determine the polynomial that represents the total stopping distance T. (b) Use the result of part (a) to estimate the total stopping distance when x=30,x=40, andx=55 miles per hour. (c) Use the bar graph to make a statement about the total stopping distance required forincreasing speeds.arrow_forward
 Trigonometry (MindTap Course List)TrigonometryISBN:9781337278461Author:Ron LarsonPublisher:Cengage Learning
 Algebra and Trigonometry (MindTap Course List)AlgebraISBN:9781305071742Author:James Stewart, Lothar Redlin, Saleem WatsonPublisher:Cengage Learning
 College AlgebraAlgebraISBN:9781305115545Author:James Stewart, Lothar Redlin, Saleem WatsonPublisher:Cengage Learning
 Glencoe Algebra 1, Student Edition, 9780079039897...AlgebraISBN:9780079039897Author:CarterPublisher:McGraw Hill
 Algebra & Trigonometry with Analytic GeometryAlgebraISBN:9781133382119Author:SwokowskiPublisher:Cengage