Videos
The bubble sort is an inefficient, but easy-to-program, sorting technique. The idea behind the sort is to move down through an array comparing adjacent pairs and swapping the values if they are out of order. For this method to sort the array completely, it may need to pass through it many times. As the passes proceed for an ascending-order sort, the smaller elements in the array appear to rise toward the top like bubbles. Eventually, there will be a pass through the array where no swaps are required. Then, the array is sorted. After the first pass, the largest value in the array drops directly to the bottom. Consequently, the second pass only has to proceed to the second-to-last value, and so on. Develop a program to set up an array of 20 random numbers and sort them in ascending order with the bubble sort (Fig. P2.12).
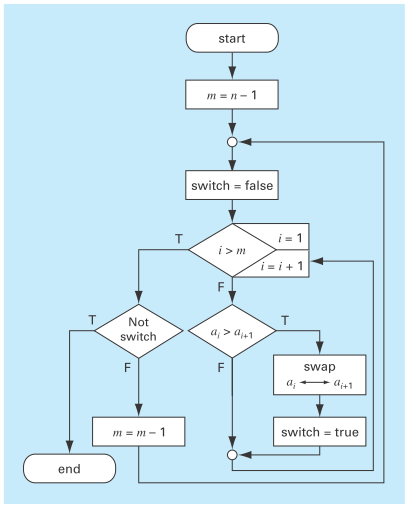
FIGURE P2.12
Want to see the full answer?
Check out a sample textbook solution
Chapter 2 Solutions
EBK NUMERICAL METHODS FOR ENGINEERS
Additional Engineering Textbook Solutions
Basic Technical Mathematics
Fundamentals of Differential Equations (9th Edition)
Advanced Engineering Mathematics
Thinking Mathematically (6th Edition)


- The following tools / resources may be useful for you to complete the assignment:a. Chatgpt (You may use it to learn Matlab coding or any other computer language. An example is given here: https://shareg.pt/mXHGne9 ). Please take note that code generated by chatgpt can be directly copied and pasted.b. Matlabi) Useful cheat sheet (https://n.ethz.ch/~marcokre/download/ML-CheatSheet.pdf)ii) Getting started with Matlab (https://matlabacademy.mathworks.com/en/details/gettingstarted )iii) Getting 30-day Matlab trial license (https://www.mathworks.com/campaigns/products/trials.html ) iv) Polyfit (https://www.mathworks.com/help/matlab/ref/polyfit.html )v) Exponential Fit (https://www.mathworks.com/matlabcentral/answers/91159-how-do-i-fit-an-exponential-curve-to-my-data)c. PlotDigitizer (https://plotdigitizer.sourceforge.net/ ) or a free online app that does not requires installation (https://plotdigitizer.com/app )You may use your own engineering judgement to make any assumptions on any…arrow_forwardLet there be five jobs of the same type and one machine to get those jobs done. The processing time of the job on the machine and the time allowed for the job to be completed for each job are given in the table below. Job On the machinecompletion time(minute) Allowed To be finishedtime (minute) 1 3 4 2 6 8 3 8 12 4 4 15 5 2 11 Apply the branch-and-boundary method step by step to order the jobs in a way that minimizes the total delay time. State the optimal solution clearly. Thank you so much.arrow_forwardUse the formal definition of the limit of a sequence to prove the following limit.arrow_forward
- Create the following images in AUTOCAD using web.autocad.com (Take screenshots of your work.) Design 3 6.50 1.50-- 3.50 1.00 1.00 4.00 1.00 1.75 2.75 4.75arrow_forwardPlease help, this for Matlab the image is the first question with following 2 and 3 they go together. 2. Solving the question by using bisection.m with the stopping criterion at 1%. Report the root and # of iterations. 3. by using newton-Raphson matlab script with the stopping criterion at 0.1%. Report the root and # of iterations.arrow_forwardSolve the last highlight by red pen experession only In which they said to draw a grapharrow_forward
- You solved 1 2 3 for me. I uploaded to get 1,2,3,4,5,6 to get solved and now I am asking for 4, 5, 6 and you are rejecting it. Could you solve 4,5,6 please?arrow_forwardWhat is the return type of angles function in MATLAB ?arrow_forwardI wanted to know how to create plots like these in MATLAB. I belive they were called herpolhode plots.arrow_forward
- 2. (If relevant) A clearly labeled diagram (or diagrams) clearly pertaining to your analysis with a coordinate system and relevant labels. Final answer with appropriate units and significant figures. You can use the fprintf() command in MATLAB to format numerical results A 2-3 sentence reflection on your answer. Does it make sense? Why or why not? What are some implications?arrow_forwardAs the potential across the resistor increased, the current through the resistor increased. If the change in current is proportional to the voltage, the data should be in a straight line and it should go through zero. In these two examples how close is the y-intercept to zero? Is there a proportional relationship between voltage and current? If so, write the equation for each run in the form potential = constant x current. (Use a numerical value for the constant.)arrow_forwardMy professor said that I need to use the numbers as shown on the picture and make the exact graph that is also shown on the picture. But I don’t know how to put this in to MATLAB. Please send the code that makes the graph that is shown in the picture. Make it 100% exactly the same.arrow_forward
 Elements Of ElectromagneticsMechanical EngineeringISBN:9780190698614Author:Sadiku, Matthew N. O.Publisher:Oxford University Press
 Mechanics of Materials (10th Edition)Mechanical EngineeringISBN:9780134319650Author:Russell C. HibbelerPublisher:PEARSON
 Thermodynamics: An Engineering ApproachMechanical EngineeringISBN:9781259822674Author:Yunus A. Cengel Dr., Michael A. BolesPublisher:McGraw-Hill Education
 Control Systems EngineeringMechanical EngineeringISBN:9781118170519Author:Norman S. NisePublisher:WILEY
 Mechanics of Materials (MindTap Course List)Mechanical EngineeringISBN:9781337093347Author:Barry J. Goodno, James M. GerePublisher:Cengage Learning
 Engineering Mechanics: StaticsMechanical EngineeringISBN:9781118807330Author:James L. Meriam, L. G. Kraige, J. N. BoltonPublisher:WILEY