Concept explainers
Videos
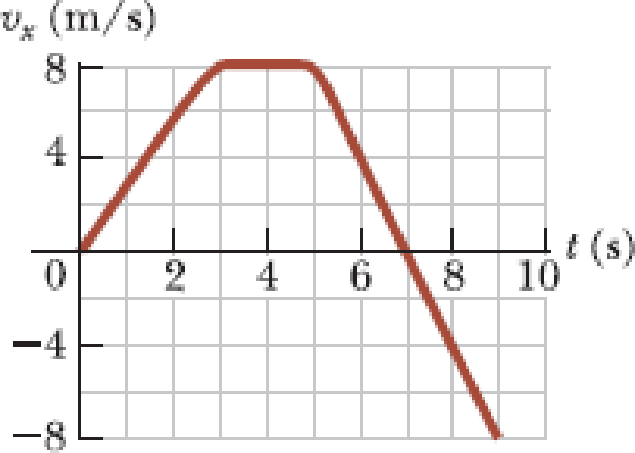
A student drives a moped along a straight road as described by the velocity-versus-time graph in Figure P2.12. Sketch this graph in the middle of a sheet of graph paper. (a) Directly above your graph, sketch a graph of the position versus time, aligning the time coordinates of the two graphs. (b) Sketch a graph of the acceleration versus time directly below the velocity-versus-time graph, again aligning the time coordinates. On each graph, show the numerical values of x and ax for all points of inflection. (c) What is the acceleration at t = 6.00 s? (d) Find the position (relative to the starting point) at t = 6.00 s. (e) What is the moped’s final position at t = 9.00 s?
Figure P2.12
(a)
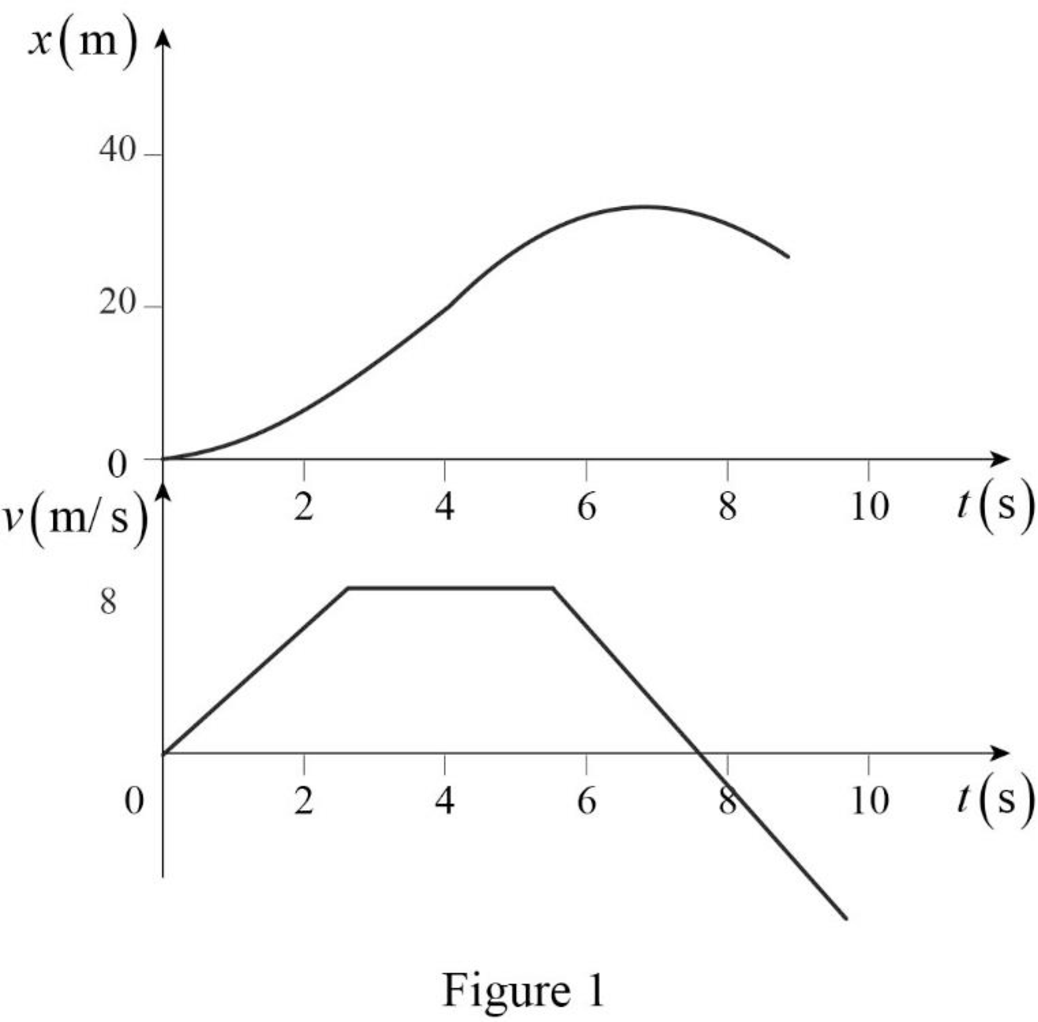
The graph of the position versus time, aligning the time coordinates with the given velocity versus time graph.
Answer to Problem 12P
The graph of the position versus time, aligning the time coordinates with the given velocity versus time graph is

Explanation of Solution
Assume that
From the velocity versus time graph in Figure P2.12, the inflection points are
Write the equation for the final position of a particle moving in one dimension under constant acceleration.
Here,
From the velocity versus time graph, the velocity of the particle at
Substitute
From
Write the equation for the final position of a particle moving with constant velocity in one dimension.
Here,
From the velocity versus time graph, the constant velocity at
Substitute
From
From the velocity versus time graph, the velocity of the particle at
Substitute
From figure P2.12, after
The graph of the position versus time, aligning the time coordinates with the given velocity versus time graph is shown in figure 1.
Conclusion:
Thus, the graph of the position versus time, aligning the time coordinates with the given velocity versus time graph is shown in figure 1.
(b)
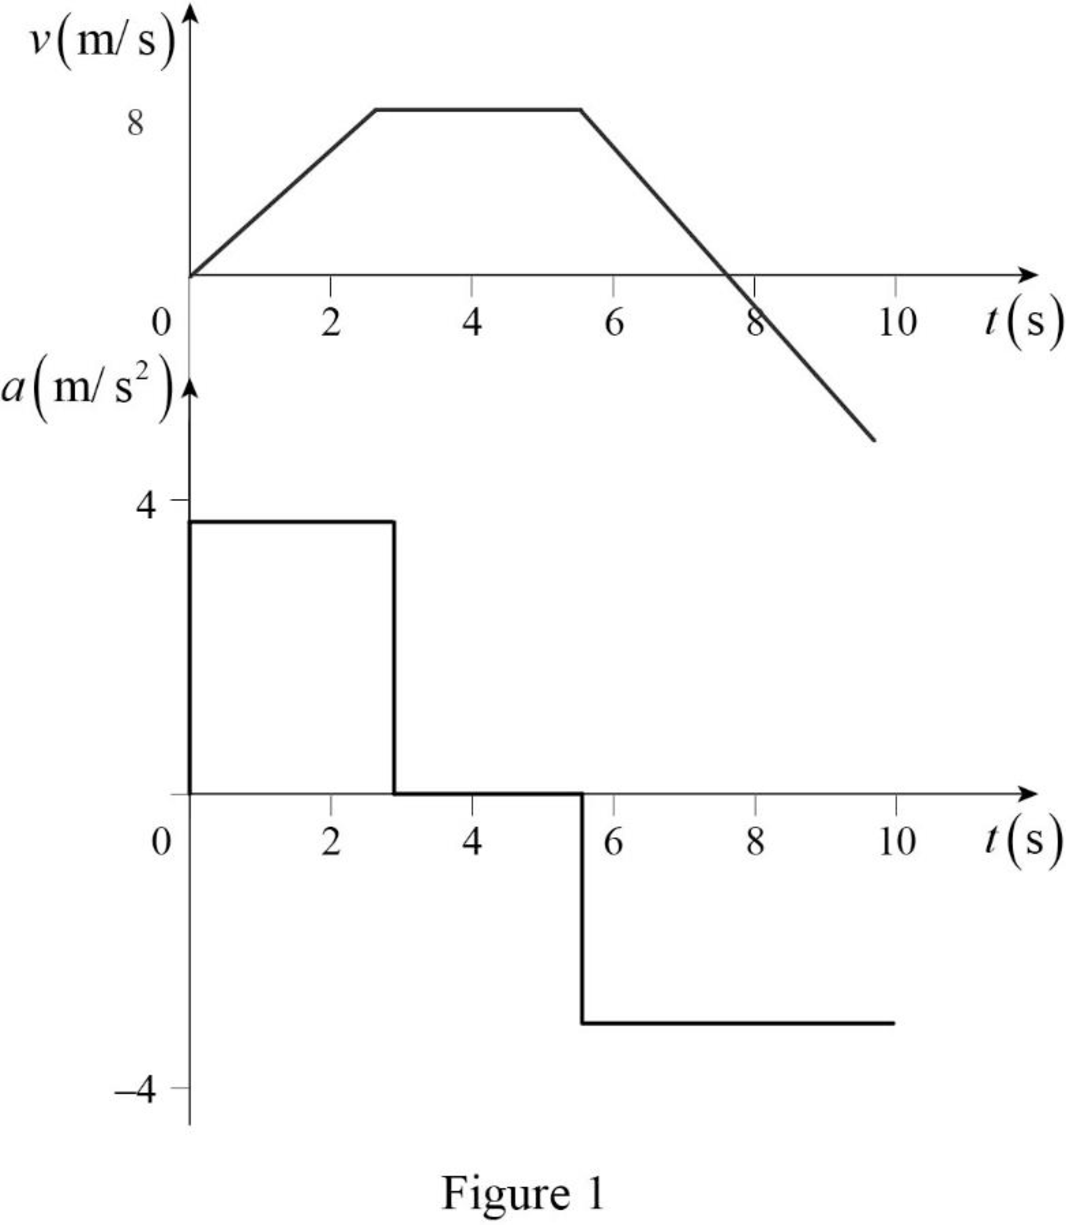
The graph of the acceleration versus time, aligning the time coordinates with the given velocity versus time graph and to show the numerical values of
Answer to Problem 12P
The graph of the acceleration versus time, aligning the time coordinates with the given velocity versus time graph is
Explanation of Solution
Write the equation for the acceleration.
Here,
Substitute
In the interval
The slope of the velocity versus time curve changes abruptly at the points of inflection
Substitute
The graph of the acceleration versus time, aligning the time coordinates with the given velocity versus time graph is shown in figure 2.

Conclusion:
Thus, the graph of the acceleration versus time, aligning the time coordinates with the given velocity versus time graph is shown in figure 2.
(c)
The acceleration at
Answer to Problem 12P
The acceleration at
Explanation of Solution
The acceleration is given by equation (III). The particle is under constant acceleration during
Conclusion:
Substitute
Therefore, the acceleration at
(d)
The position of the moped at
Answer to Problem 12P
The position of the moped at
Explanation of Solution
The particle is under constant acceleration during
Conclusion:
From the position versus time graph, the position of the particle at
Substitute
Therefore, the position of the moped at
(e)
The position of the moped at
Answer to Problem 12P
The position of the moped at
Explanation of Solution
The particle is under constant acceleration during
Conclusion:
From the position versus time graph, the position of the particle at
Substitute
Therefore, the position of the moped at
Want to see more full solutions like this?
Chapter 2 Solutions
Principles of Physics


- An object is at x = 0 at t = 0 and moves along the x axis according to the velocitytime graph in Figure P2.40. (a) What is the objects acceleration between 0 and 4.0 s? (b) What is the objects acceleration between 4.0 s and 9.0 s? (c) What is the objects acceleration between 13.0 s and 18.0 s? (d) At what time(s) is the object moving with the lowest speed? (e) At what time is the object farthest from x = 0? (f) What is the final position x of the object at t = 18.0 s? (g) Through what total distance has the object moved between t = 0 and t = 18.0 s? Figure P2.40arrow_forwardReferring to the figure, a truck drives a distance d=30.1m in the positive x direction in a time t1=17.2s, at which point the truck brakes, coming to rest in t2=8.13s. Part A: What is the truck's average velocity in the horizontal direction, in meters per second, during the t1 time period? Part B: Assuming the truck started from rest and moved with a constant acceleration, what was the acceleration, in meters per suqared second, during the time interval t1? Part C: What was the truck's instananeous velocity in the horizontal direction, in meters per second, when it began braking? And using the result from the previous answer, what was the truck's horizontal component of acceleration, in meters per squared second, during the braking period? Please explain how you got your answer in detail.arrow_forwardThe graph shows the time records of the position, velocity, and acceleration of a hummingbird, as it hovers back and forth along a straight line near a tempting feeder, trying to decide if it wants to take a drink of nectar. The units for the quantities are m, m/s, and m/ s2s2. Which is which? a. Position: B; Velocity: C; Acceleration: A b. Position: C; Velocity: A; Acceleration: Bc. Position: A; Velocity: C; Acceleration: Bd. Position: C; Velocity: B; Acceleration: Ae. Position: B; Velocity: A; Acceleration: Carrow_forward
- The velocity-versus-time graph for a car driving down a straight road is shown. What is the acceleration of the car during the period shown?A. 1.0 m/s2 B. 2.5 m/s2C. 3.8 m/s2 D. 5.0 m/s2arrow_forwardFor the following scenarios is there an instant when the average velocity for the time interval will equal the instantaneous velocity? a) A hockey puck slides across a frozen pond without slowing down b) a race car takes a lap at a race track at a constant speed c) a ball is thrown directly up, rises to its highest point and then falls back to the same height.arrow_forwardA body moves in a straight line according to this equation of motion: s(t) = 10+2 4t + 8, where t is measured in seconds and s in meters. a. What is its position at the end of 5 sec? b. What is the equation for its velocity v at any time t? c. What is its velocity v at the end of 5 seconds? d. What is the equation for its acceleration a at any time t? e. What is its acceleration at the end of 5 seconds?arrow_forward
- Starting from rest at time t = 0, a car accelerates from a stop sign in the positive x direction along a long straight road with a constant acceleration of 2 m/s2. A truck travels along the same road at a constant velocity of 30 m/s. At time t = 0, the truck was 10 km in front of the the car. How long does it take for the car to catch up to the truck? The answer to one significant figure isarrow_forwardThe velocity vs time graph for an object is shown. How far has it gone in 4.5 seconds starting at t = 0s? The figure shows the velocity versus time graph for an object. From t = -3 to 0s, the velocity is constant at 45 m/s. From t=0 to 4.5s, velocity decreases linearly from 45 m/s to 0 m/s. 101 m 225 m 150 m 112 marrow_forwarda tennis ball is thrown straight up and caught at the same height on the way down. which of the following can describe the motion of the ball when it reached its maximum height? a. The acceleration of the ball is zero b. The acceleration of the ball is 9.8 m/s^2 down c. b. The acceleration of the ball is 9.8 m/s^2 down d. The velocity of the ball is zeroarrow_forward
- A world-class sprinter accelerates to his maximum speed in 4.0 s. He then maintain this speed for the remainder of a 100-m race, finishing with a total time of 9.1 s (a) what is the runner’s average acceleration during the first 4.0 s? (b) what is his average acceleration during the last 5.1 s (c) what is his average acceleration for the entire race?arrow_forwardA car starts from rest and travels for 5.0 s with a uniform acceleration of +1.5 m/s 2. The driver then applies the brakes, causing a uniform acceleration of −2.0 m/s 2. If the brakes are applied for 3.0 s, (a) how fast is the car going at the end of the braking period, and (b) how far has the car gone?arrow_forwardA bus moves along an x-axis a distance of 800 m, starting at rest (at x = 0) and ending at rest (at x = 800 m). Through the first 2 of that distance, its acceleration is +2.15 m/s?. Through the rest of the distance, its acceleration is -0.92 m/s?. Calculate a) time taken to cover the first half of the distance? b) the bus's maximum speed? c) total time to cover 800 m distance? Sketch velocity time graphs.arrow_forward
 Principles of Physics: A Calculus-Based TextPhysicsISBN:9781133104261Author:Raymond A. Serway, John W. JewettPublisher:Cengage Learning