Concept explainers
Videos
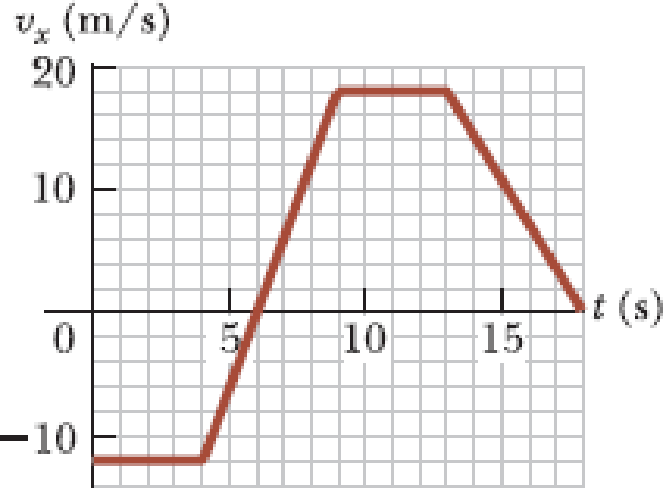
An object is at x = 0 at t = 0 and moves along the x axis according to the velocity–time graph in Figure P2.40. (a) What is the object’s acceleration between 0 and 4.0 s? (b) What is the object’s acceleration between 4.0 s and 9.0 s? (c) What is the object’s acceleration between 13.0 s and 18.0 s? (d) At what time(s) is the object moving with the lowest speed? (e) At what time is the object farthest from x = 0? (f) What is the final position x of the object at t = 18.0 s? (g) Through what total distance has the object moved between t = 0 and t = 18.0 s?
Figure P2.40
(a)
The object’s acceleration between
Answer to Problem 40P
The object’s acceleration between
Explanation of Solution
Acceleration is a measure of how rapidly the velocity is changing. It is defined as the change in velocity per unit time. The slope of the velocity versus time graph in a particular time interval gives the acceleration during that interval.
In the given velocity versus time graph, the curve is a straight parallel to the time axis between
Conclusion:
Therefore, the object’s acceleration between
(b)
The object’s acceleration between
Answer to Problem 40P
The object’s acceleration between
Explanation of Solution
The slope of the graph in the given interval gives the acceleration of the object during it.
Write the equation for the acceleration of the object between
Here,
Conclusion:
From the graph, the value of
Substitute
Therefore, the object’s acceleration between
(c)
The object’s acceleration between
Answer to Problem 40P
The object’s acceleration between
Explanation of Solution
Write the equation for the acceleration of the object between
Here,
Conclusion:
From the graph, the value of
Substitute
Therefore, the object’s acceleration between
(d)
The times at which the object moves with the lowest speed.
Answer to Problem 40P
The times at which the object moves with the lowest speed are
Explanation of Solution
In a velocity versus time graph, the velocity of an object will be plotted as a function of time. The velocity at a particular instant of time can be directly observed from the graph. Speed is the magnitude of velocity.
Speed can never be negative. The lowest possible value of speed is zero. In the graph, the velocity of the object is zero at
Conclusion:
Therefore, the times at which the object moves with the lowest speed are
(e)
The time at which the object is farthest from
Answer to Problem 40P
The time at which the object is farthest from
Explanation of Solution
The given velocity versus time graph is of an object starting from
From
Conclusion:
Therefore, the time at which the object is farthest from
(f)
The final position of the object at
Answer to Problem 40P
The final position of the object at
Explanation of Solution
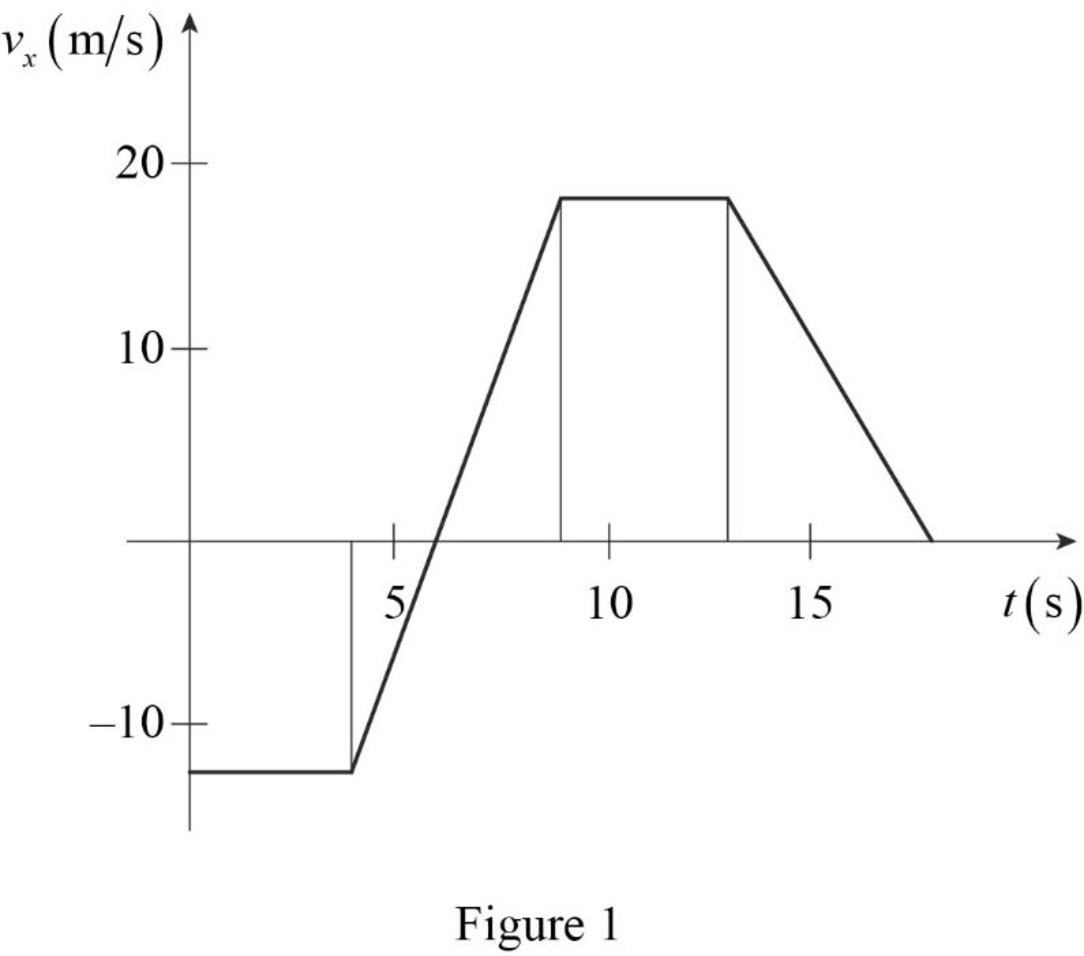
The cumulative area under the graph gives the maximum distance attained by the object.
The velocity versus time graph is shown below.
Write the equation for the area of a rectangle.
Here,
Write the equation for the area of a triangle.
Here,
The area from
In figure 1, the length of the rectangle from
Substitute
Here,
The area from
In figure 1, the base of the triangle from
Substitute
Here,
The area from
In figure 1, the base of the triangle from
Substitute
Here,
The area from
In figure 1, the length of the rectangle from
Substitute
Here,
The area from
In figure 1, the base of the triangle from
Substitute
Here,
Write the equation for the farthest distance.
Here,
Conclusion:
Substitute
Therefore, the final position of the object at
(g)
The total distance the object has moved between
Answer to Problem 40P
The total distance the object has moved between
Explanation of Solution
The total distance travelled can be calculated by counting all contributions computed in part (f) as positive.
Conclusion:
Substitute
Here,
Therefore, the total distance the object has moved between
Want to see more full solutions like this?
Chapter 2 Solutions
Principles of Physics: A Calculus-Based Text


- As an object moves along the x axis, many measurements are made of its position, enough to generate a smooth, accurate graph of x versus t. Which of the following quantities for the object cannot be obtained from this graph alone? (a) the velocity at any instant (b) the acceleration at any instant (c) the displacement during some time interval (d) the average velocity during some time interval (e) the speed at any instantarrow_forwardOne drop of oil falls straight down onto the road from the engine of a moving car every 5 s. Figure OQ2.1 shows the pattern of the drops left behind on the pavement. What is the average speed of the car over this section of its motion? (a) 20 m/s (b) 24 m/s (c) 30 m/s (d) 100 m/s (e) 120 m/s Figure OQ2.1arrow_forwardA racing car starts from rest at t = 0 and reaches a final speed at time t. II the acceleration of the car is constant during this time, which of the following statements are true? (a) The car travels a distance t. (b) The average speed of the car is /2. (c) The magnitude of the acceleration of the car is /t. (d) The velocity of the car remains constant, (e) None of statements (a) through (d) is true.arrow_forward
- A positiontime graph for a particle moving along the x axis is shown in Figure P2.5. (a) Find the average velocity in the time interval t = 1.50 s to t = 4.00 s. (b) Determine the instantaneous velocity at t = 2.00 s by measuring the slope of the tangent line shown in the graph. (c) At what value of t is the velocity zero? Figure P2.5arrow_forwardFigure P2.15 shows a graph of vx versus t for the motion of a motorcyclist as he starts from rest and moves along the road in a straight line. (a) Find the average acceleration for the time interval t = 0 to t = 6.00 s. (b) Estimate the time at which the acceleration has its greatest positive value and the value of the acceleration at that instant. (c) When is the acceleration zero? (d) Estimate the maximum negative value of the acceleration and the time at which it occurs. Figure P2.15arrow_forwardThe velocity of a particle moving along the x axis from A to B varies according to the expression vx = 50 - 6t2 , where vx is in meters per second and t is in seconds. Find the average acceleration in the time interval t = 0 to t = 2.0 s (a) 1 m/s2 (b) -5.5 m/s2 (c) 7.5 m/s2 (d) -12 m/s2arrow_forward
- The graph shows the time records of the position, velocity, and acceleration of a hummingbird, as it hovers back and forth along a straight line near a tempting feeder, trying to decide if it wants to take a drink of nectar. The units for the quantities are m, m/s, and m/ s2s2. Which is which? a. Position: B; Velocity: C; Acceleration: A b. Position: C; Velocity: A; Acceleration: Bc. Position: A; Velocity: C; Acceleration: Bd. Position: C; Velocity: B; Acceleration: Ae. Position: B; Velocity: A; Acceleration: Carrow_forwardAn object with an initial speed of 12 m / s in the west direction is subjected to a constant acceleration of 4 m / s2 in the west direction for 3 s. During this time, the object travels a distance of: a) 144 m b) 24 m c) 18 m d) 54 m e) 36 marrow_forwardA Honda Civic travels in a straight line along a road. Its distance x from a stop sign is given as a function of time t by the equation x(t) = At2 – Bt3 , where A = 1.50m/s2 and B = 0.0500 m/s2 . Calculate the average velocity of the car for each time interval (a) t1 = 0s to t2 = 1.0 s, (b) t1 = 0s to t2 = 4.0 s , (c) t1 = 2.0 s to t2 = 4.0 sarrow_forward
 Principles of Physics: A Calculus-Based TextPhysicsISBN:9781133104261Author:Raymond A. Serway, John W. JewettPublisher:Cengage Learning
 Glencoe Physics: Principles and Problems, Student...PhysicsISBN:9780078807213Author:Paul W. ZitzewitzPublisher:Glencoe/McGraw-Hill
 Physics for Scientists and Engineers, Technology ...PhysicsISBN:9781305116399Author:Raymond A. Serway, John W. JewettPublisher:Cengage Learning
 Physics for Scientists and Engineers: Foundations...PhysicsISBN:9781133939146Author:Katz, Debora M.Publisher:Cengage Learning