
(a)
To graph:
Also, to find the populations at
(a)
Explanation of Solution
Given information:
Fish released into the lake (at time
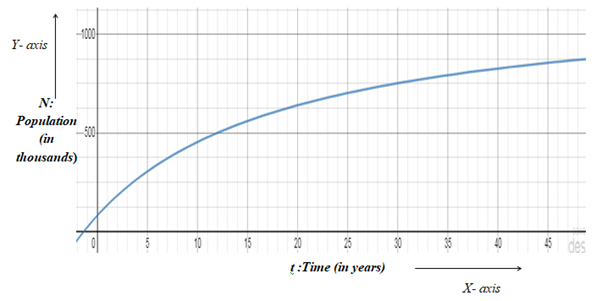
Graph:
In order to plot the graph, various data points need to be plotted which are then joined to draw a smooth graph.The data points are shown in the table below.
| Time (in years) | Population (in thousands) |
| 0 | 80 |
| 5 | 304 |
| 10 | 453.33 |
| 15 | 560 |
| 20 | 640 |
| 25 | 702.22 |
Here,
Interpretation:
To find the populations at
Finding the corresponding y -coordinate for the x -coordinate i.e.
| Time (in years) | Population (in thousands) |
| 5 | 312 |
| 10 | 450 |
| 25 | 700 |
One can check that the values estimated from the graph are close to the true values in the above table using which the graph was plotted.
(b)
Maximum number of fish in the lake as time passes.
(b)
Answer to Problem 153RE
Explanation of Solution
Given information:
Concept used:
Graphical approach
Calculation:
From the graph plotted it can be observed that the population keeps on increasing with increase in time and hence, the maximum number of fish can be obtained when time
As
Conclusion:
Maximum number of fish in the lake as time passes:
Chapter 2 Solutions
Precalculus with Limits: A Graphing Approach

 Calculus: Early TranscendentalsCalculusISBN:9781285741550Author:James StewartPublisher:Cengage Learning
 Thomas' Calculus (14th Edition)CalculusISBN:9780134438986Author:Joel R. Hass, Christopher E. Heil, Maurice D. WeirPublisher:PEARSON
 Calculus: Early Transcendentals (3rd Edition)CalculusISBN:9780134763644Author:William L. Briggs, Lyle Cochran, Bernard Gillett, Eric SchulzPublisher:PEARSON
 Calculus: Early TranscendentalsCalculusISBN:9781319050740Author:Jon Rogawski, Colin Adams, Robert FranzosaPublisher:W. H. Freeman
 Calculus: Early Transcendental FunctionsCalculusISBN:9781337552516Author:Ron Larson, Bruce H. EdwardsPublisher:Cengage Learning