
Concept explainers
Videos
a.
To graph: The data of the table.
a.
Answer to Problem 91E
Explanation of Solution
Given: The table shows below,
Using graphing utility to plot the points and graph the model.
The
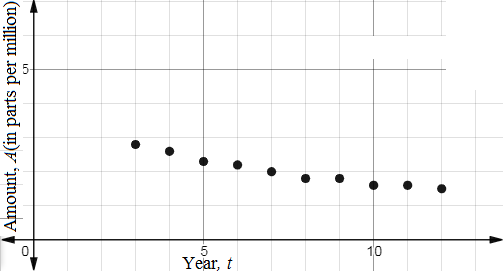
Now draw the model of data.
b.
To find: The rational model of the data.
b.
Answer to Problem 91E
Explanation of Solution
Given: The table shows below,
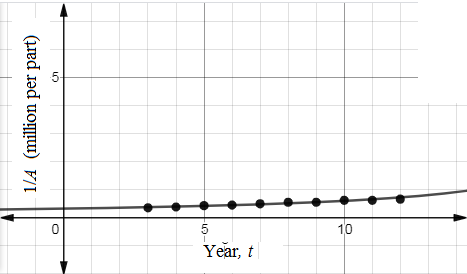
Take the reciprocal of A to generate the points
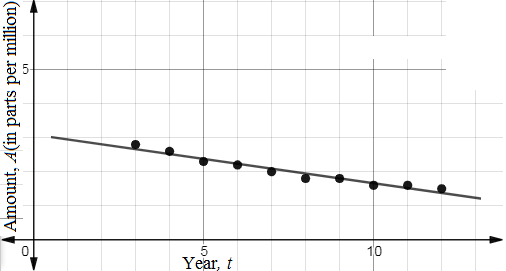
Using above part (a), the linear regression was
So, reciprocal of this,
So,
Now make new table of 1/ A
Now plot the points and rational model of the data.
c.
To find: The rational model of the data.
c.
Answer to Problem 91E
Explanation of Solution
Given: The table shows below,
Rational model,
Linear model,
Choose rational model because this model shows data perfectly. In this model output million per part. It shows as number of increase carbon monoxide amount increases.
Chapter 2 Solutions
Precalculus with Limits: A Graphing Approach


 Calculus: Early TranscendentalsCalculusISBN:9781285741550Author:James StewartPublisher:Cengage Learning
 Thomas' Calculus (14th Edition)CalculusISBN:9780134438986Author:Joel R. Hass, Christopher E. Heil, Maurice D. WeirPublisher:PEARSON
 Calculus: Early Transcendentals (3rd Edition)CalculusISBN:9780134763644Author:William L. Briggs, Lyle Cochran, Bernard Gillett, Eric SchulzPublisher:PEARSON
 Calculus: Early TranscendentalsCalculusISBN:9781319050740Author:Jon Rogawski, Colin Adams, Robert FranzosaPublisher:W. H. Freeman
 Calculus: Early Transcendental FunctionsCalculusISBN:9781337552516Author:Ron Larson, Bruce H. EdwardsPublisher:Cengage Learning