
Videos
Heavenly Chocolates manufactures and sells quality chocolate products at its plant and retail store located in Saratoga Springs, New York. Two years ago, the company developed a web site and began selling its products over the Internet. Web-site sales have exceeded the company’s expectations, and management is now considering strategies to increase sales even further. To learn more about the web-site customers, a sample of 50 Heavenly Chocolate transactions was selected from the previous month’s sales. Data showing the day of the week each transaction was made, the type of browser the customer used, the time spent on the web site, the number of web pages viewed, and the amount spent by each of the 50 customers are contained in the file named Heavenly Chocolates. A portion of the data is shown in the table that follows:
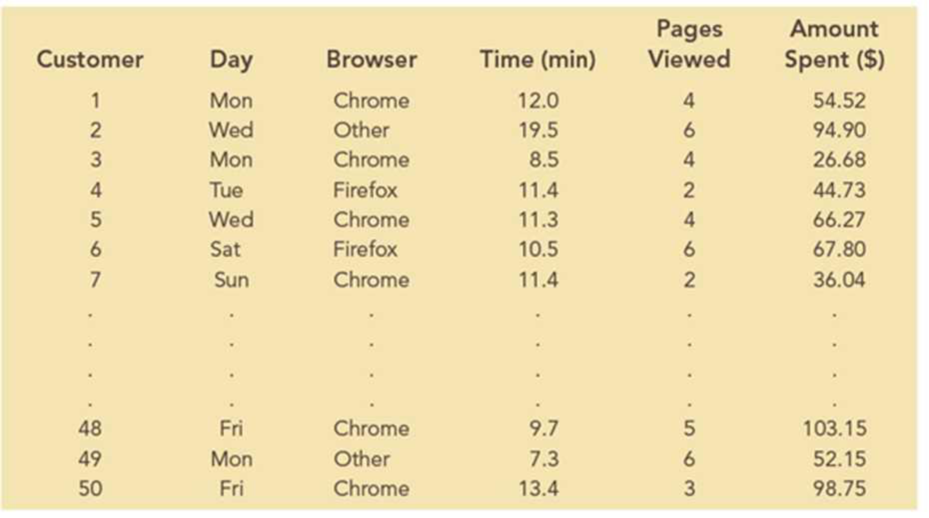
Heavenly Chocolates would like to use the sample data to determine whether online shoppers who spend more time and view more pages also spend more money during their visit to the web site. The company would also like to investigate the effect that the day of the week and the type of browser have on sales.
Managerial Report
Use the methods of
- 1. Graphical and numerical summaries for the length of time the shopper spends on the web site, the number of pages viewed, and the mean amount spent per transaction. Discuss what you learn about Heavenly Chocolates’ online shoppers from these numerical summaries.
- 2. Summarize the frequency, the total dollars spent, and the mean amount spent per transaction for each day of week. Discuss the observations you can make about Heavenly Chocolates’ business based on the day of the week?
- 3. Summarize the frequency, the total dollars spent, and the mean amount spent per transaction for each type of browser. Discuss the observations you can make about Heavenly Chocolates’ business based on the type of browser?
- 4. Develop a
scatter diagram , and compute the samplecorrelation coefficient to explore the relationship between the time spent on the web site and the dollar amount spent. Use the horizontal axis for the time spent on the web site. Discuss your findings. - 5. Develop a scatter diagram, and compute the sample correlation coefficient to explore the relationship between the number of web pages viewed and the amount spent. Use the horizontal axis for the number of web pages viewed. Discuss your findings.
- 6. Develop a scatter diagram, and compute the sample correlation coefficient to explore the relationship between the time spent on the web site and the number of pages viewed. Use the horizontal axis to represent the number of pages viewed. Discuss your findings.
1. Provide the graphical and numerical summaries for the length of time that the shopper spends on the website, the number of pages viewed, and the mean amount spent per transaction. Explain that is observed from the numerical summaries.
2. Give a summary for the frequency, the total dollars spent, and the mean amount spent per transaction for each day of week. Give interpretation.
3. Give a summary for the frequency, the total dollars spent, and the mean amount spent per transaction for each type of browser. Give interpretation.
4. Give a scatter diagram and calculate the sample correlation coefficient to explore the relationship between the time spent on the web site and the dollar amount spent. Give interpretation.
5. Give a scatter diagram and calculate the sample correlation coefficient to explore the relationship between the number of web pages viewed and the dollar amount spent. Give interpretation.
6. Give a scatter diagram and calculate the sample correlation coefficient to explore the relationship between the time spent on the web site and the number of pages viewed. Give interpretation.
Answer to Problem 1C
1. Numerical summaries:
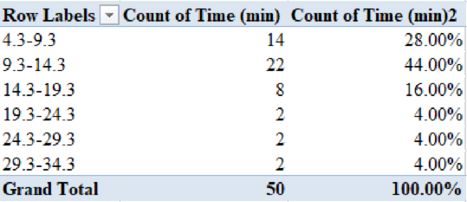
The frequency distribution and percent frequency distribution for the length of time that the shopper spends on the website are given below:
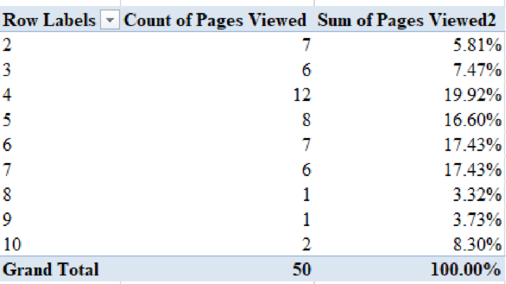
The frequency distribution and percent frequency distribution for the number of pages viewed are given below:
The frequency distribution and percent frequency distribution for the amount spent are given below:
The mean amount spent per transaction is obtained as 68.13.
Graphical summary:
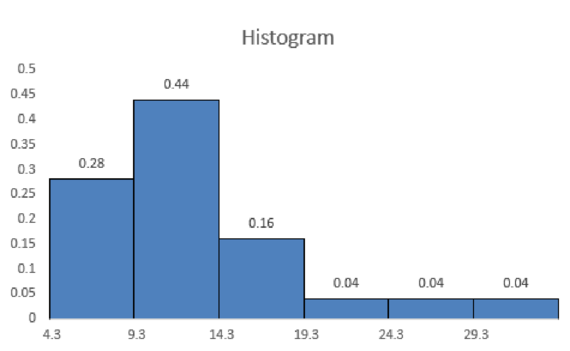
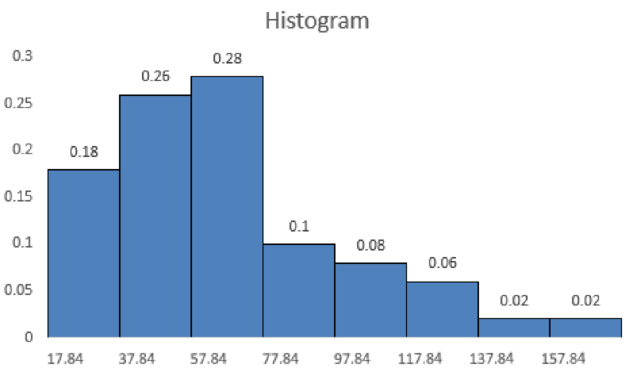
The histogram for the length of time that the shopper spends on the website is shown below:
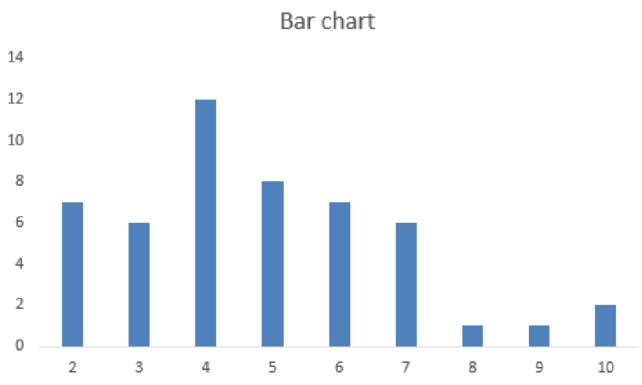
The bar chart for the number of pages viewed is shown below:
The histogram for the amount spent is shown below:
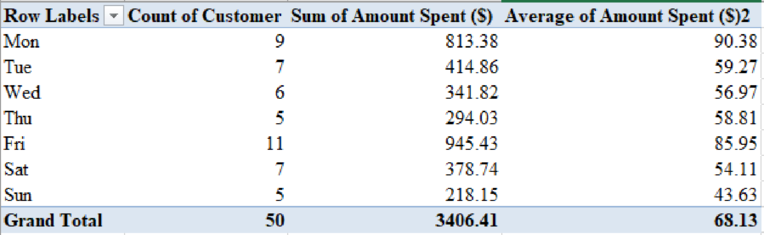
2. The frequency, the total dollars spent, and the mean amount spent per transaction for each day of week are as follows:
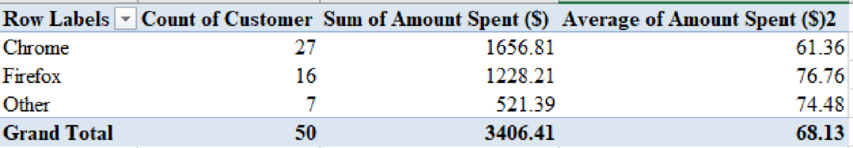
3. The frequency, the total dollars spent, and the mean amount spent per transaction for each type of browser are as follows:
4. The scatter diagram of the time spent on the web site and the dollar amount spent are shown below:
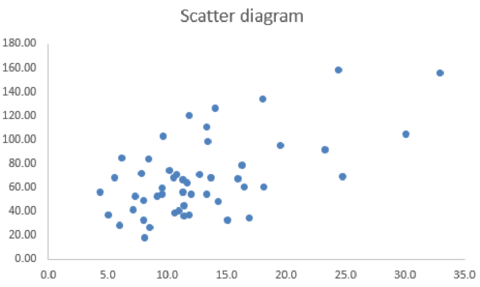
The sample correlation coefficient that explores the relationship between the time spent on the web site and the dollar amount spent is 0.58.
5. The scatter diagram of the number of web pages viewed and the dollar amount spent are given below:
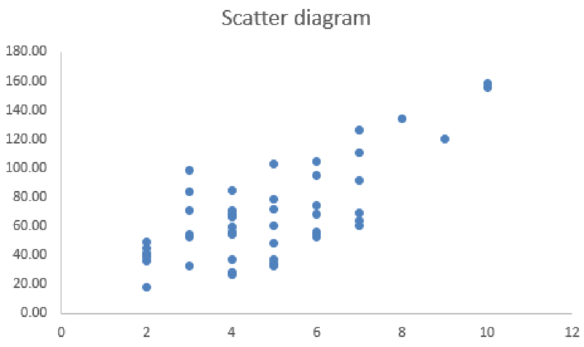
The sample correlation coefficient that explores the relationship between the number of web pages viewed and the dollar amount spent is 0.72.
6. The scatter diagram of the time spent on the web site and the number of pages viewed are shown below:
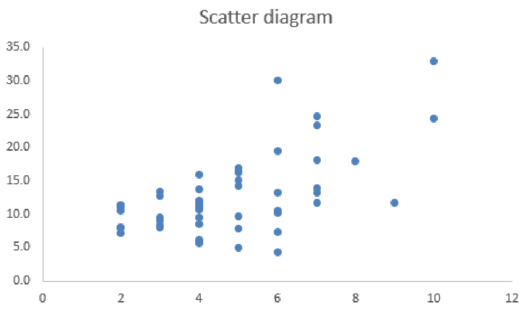
The sample correlation coefficient that explores the relationship between the time spent on the web site and the number of pages viewed is 0.60.
Explanation of Solution
1.
Numerical summary:
Step-by-step procedure to create frequency distribution and percent frequency distribution for the length of time the shopper spends on the website using an Excel:
- Select Insert > PivotTable.
- In Select a table or range, select the data of Time (min) and click OK.
- In PivotTable Fields, move Time (min) to Rows and Σ Values.
- Right click on a value from Row Labels and select Group.
- Enter 5 in By.
- Click on Time (min) from Σ Values.
- Select Value Field settings.
- In Summarize value field by, choose Count and click OK.
- Again, move Time (min) to Rows and Σ Values.
- Click on Time (min) from Σ Values.
- Select Value Field settings.
- In Show Values As, choose % of Grand Total and click OK.
Thus, the frequency distribution and percent frequency distribution for the length of time the shopper spends on the website are obtained.
Step-by-step procedure to create frequency distribution and percent frequency distribution for the number of pages viewed using an Excel:
- Select Insert > PivotTable.
- In Select a table or range, select the data of Pages Viewed and click OK.
- In PivotTable Fields, move Pages Viewed to Rows and Σ Values.
- Right click on a value from Row Labels and select Group.
- Enter 5 in By.
- Click on Pages Viewed from Σ Values.
- Select Value Field settings.
- In Summarize value field by, choose Count and click OK.
- Again, move Pages Viewed to Rows and Σ Values.
- Click on Pages Viewed from Σ Values.
- Select Value Field settings.
- In Show Values As, choose % of Grand Total and click OK.
Thus, the frequency distribution and percent frequency distribution for the number of pages viewed are obtained.
Step-by-step procedure to obtain the mean amount spent per transaction using an Excel:
- In cell F52, enter “=AVERAGE(F2:F51)”.
- Click Enter.
Thus, the mean amount spent per transaction is obtained as 68.13.
From the numerical summaries, it is clear that the highest percent frequency for length of time that the shopper spends on the website is 9.3 hours to 14.3 hours. Also, the highest percent frequency for the number of pages viewed is 4.
Graphical summaries:
Step-by-step procedure to obtain a histogram for the length of time that the shopper spends on the website using an Excel:
- Select the data of class interval and percent frequency.
- Select Insert.
- Choose Clustered Column under Charts.
- Click on a bar in the graph.
- In Format Data Series, enter Gap width as 0%.
Thus, the histogram for the length of time that the shopper spends on the website is obtained.
Step-by-step procedure to obtain a bar chart for the number of pages viewed using an Excel:
- Select the data of class interval and frequency.
- Select Insert.
- Choose Clustered Column under Charts.
Thus, the bar chart for the number of pages viewed is obtained.
Step-by-step procedure to obtain a histogram for the amount spent using Excel:
- Select the data of class interval and percent frequency.
- Select Insert.
- Choose Clustered Column under Charts.
- Click on a bar in the graph.
- In Format Data Series, enter Gap width as 0%.
Thus, the histogram for the amount spent is obtained.
2.
Step-by-step procedure to obtain the frequency, the total dollars spent, and the mean amount spent per transaction for each day of week using an Excel:
- Select Insert > PivotTable.
- In Select a table or range, select the data of Customer, Day, and Amount Spent ($) and click OK.
- In PivotTable Fields, move Day to Rows and Customer and Amount Spent ($) to Σ Values.
- Click on Amount Spent ($) from Σ Values.
- Select Value Field settings.
- In Summarize value field by, choose Sum and click OK.
- Again, move Amount Spent ($) to Σ Values.
- Click on Amount Spent ($) from Σ Values.
- Select Value Field settings.
- In Summarize value field by, choose Average and click OK.
Thus, the frequency, the total dollars spent, and the mean amount spent per transaction for each day of week are obtained.
It is clear from the output that the average amount spent on Monday is higher than other days. However, the sum of amount spent is higher on Friday. This is because the number of customers on Friday is more than the number of customers on Monday.
3.
Step-by-step procedure to obtain the frequency, the total dollars spent, and the mean amount spent per transaction for each type of browser using an Excel:
- Select Insert > PivotTable.
- In Select a table or range, select the data of Customer, Browser, and Amount Spent ($) and click OK.
- In PivotTable Fields, move Browser to Rows and Customer and Amount Spent ($) to Σ Values.
- Click on Amount Spent ($) from Σ Values.
- Select Value Field settings.
- In Summarize value field by, choose Sum and click OK.
- Again, move Amount Spent ($) to Σ Values.
- Click on Amount Spent ($) from Σ Values.
- Select Value Field settings.
- In Summarize value field by, choose Average and click OK.
Thus, the frequency, the total dollars spent, and the mean amount spent per transaction for each type of browser are obtained.
It is clear from the output that the average amount spent for Firefox is higher than other browsers. However, the sum of amount spent is higher for chrome. This is because that the number of customers using Chrome is higher than the number of customers using Firefox.
4.
Step-by-step procedure to obtain a scatter diagram of the time spent on the web site and the dollar amount spent using an Excel:
- Select the data of Time (min) and Amount Spent ($).
- Select Insert.
- Choose Scatter under Charts.
Thus, the scatter diagram of the time spent on the web site and the dollar amount spent are obtained.
Step-by-step procedure to obtain the sample correlation coefficient that explores the relationship between the time spent on the web site and the dollar amount spent using an Excel:
- In an empty cell, type “=CORREL(D2:D51, F2:F51)”.
- Click Enter.
The sample correlation coefficient that explores the relationship between the time spent on the web site and the dollar amount spent is obtained as 0.58.
It is clear that there is a positive linear correlation between the time spent on the web site and the dollar amount spent. That is, as time spent on the web site increases, the dollar amount spent also increases.
5.
Step-by-step procedure to obtain a scatter diagram of the number of web pages viewed and the dollar amount spent using an Excel:
- Select the data of Pages Viewed and Amount Spent ($).
- Select Insert.
- Choose Scatter under Charts.
Thus, the scatter diagram of the number of web pages viewed and the dollar amount spent is obtained.
Step-by-step procedure to obtain the sample correlation coefficient that explores the relationship between the number of web pages viewed and the dollar amount spent using an Excel:
- In an empty cell, type “=CORREL(E2:E51, F2:F51)”.
- Click Enter.
The sample correlation coefficient that explores the relationship between the number of web pages viewed and the dollar amount spent is 0.72.
It is clear that there is a positive linear correlation between the number of web pages viewed and the dollar amount spent. That is, as number of web pages viewed increases, the dollar amount spent also increases.
6.
Step-by-step procedure to obtain the scatter diagram of the time spent on the web site and the number of pages viewed using an Excel:
- Select the data of Time (min) and Pages Viewed.
- Select Insert.
- Choose Scatter under Charts.
Thus, the scatter diagram of the time spent on the web site and the number of pages viewed are obtained.
Step-by-step procedure to obtain the sample correlation coefficient that explores the relationship between the time spent on the web site and the number of pages viewed using an Excel:
- In an empty cell, type “=CORREL(D2:D51, E2:E51)”.
- Click Enter.
The sample correlation coefficient that explores the relationship between the time spent on the web site and the number of pages viewed is 0.60.
It is clear that there is a positive linear correlation between the time spent on the web site and the number of pages viewed. That is, as the number of pages viewed increases, the time spent on the web site also increases.
Want to see more full solutions like this?
Chapter 2 Solutions
Essentials of Business Analytics (MindTap Course List)


 Glencoe Algebra 1, Student Edition, 9780079039897...AlgebraISBN:9780079039897Author:CarterPublisher:McGraw Hill
 Big Ideas Math A Bridge To Success Algebra 1: Stu...AlgebraISBN:9781680331141Author:HOUGHTON MIFFLIN HARCOURTPublisher:Houghton Mifflin Harcourt
 Holt Mcdougal Larson Pre-algebra: Student Edition...AlgebraISBN:9780547587776Author:HOLT MCDOUGALPublisher:HOLT MCDOUGAL
 College Algebra (MindTap Course List)AlgebraISBN:9781305652231Author:R. David Gustafson, Jeff HughesPublisher:Cengage Learning