
Concept explainers
Videos
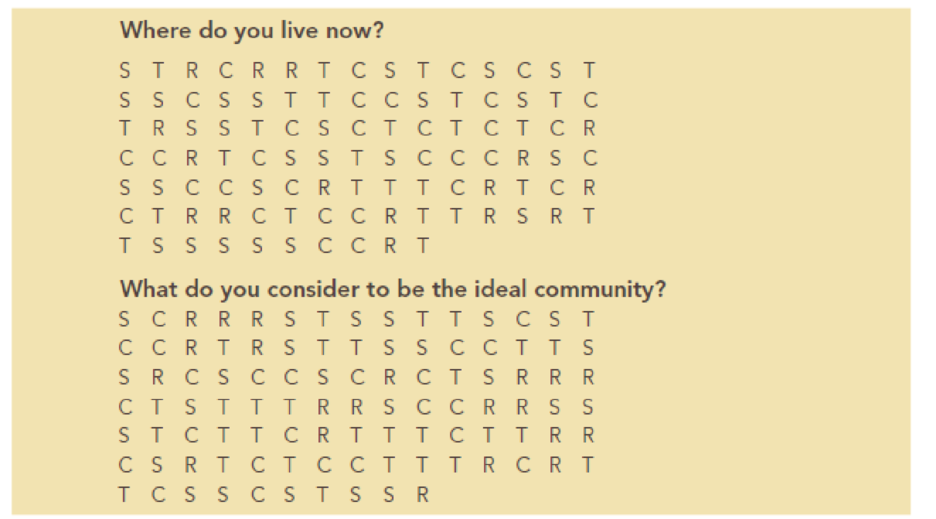
Reports have found that many U.S. adults would rather live in a different type of community than the one in which they are living now. A national survey of 2,260 adults asked: “Where do you live now?” and “What do you consider to be the ideal community?” Response options were City (C), Suburb (S), Small Town (T), or Rural (R). A representative portion of this survey for a sample of 100 respondents is as follows:
- a. Provide a percent frequency distribution and a histogram for each question.
- b. Where are most adults living now?
- c. Where do most adults consider the ideal community to be?
- d. What changes in living areas would you expect to see if people moved from where they currently live to their ideal community?
a.
Create a percent frequency distribution and histogram for each question.
Answer to Problem 8P
The percent frequency distribution for each question is as follows:
Where do you live now?
| Living area | Frequency | Percent frequency |
| C | 32 | |
| R | 16 | |
| S | 26 | |
| T | 26 |
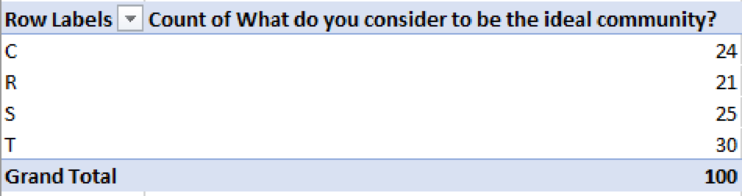
What do you consider to be the ideal community?
| Living area | Frequency | Percent frequency |
| C | 24 | |
| R | 21 | |
| S | 25 | |
| T | 30 |
The histogram for each question is as follows:
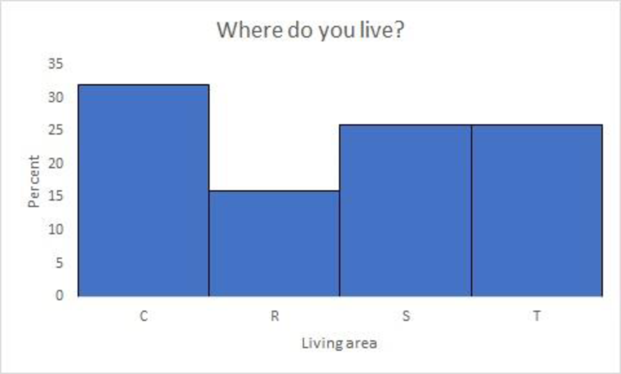
Where do you live now?
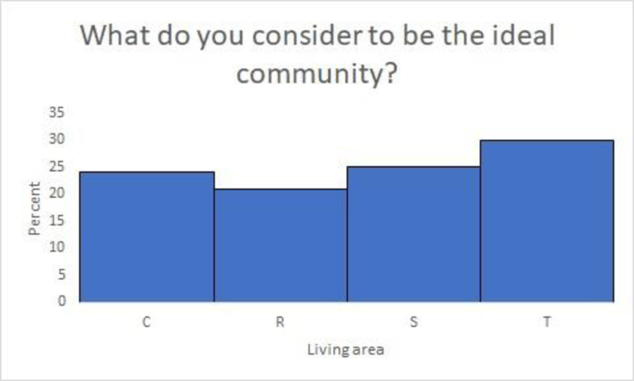
What do you consider to be the ideal community?
Explanation of Solution
Frequency distribution:
It is a table that summarizes the frequency of data values in each of several nonoverlapping bins.
Percent frequency distribution:
It is a table that summarizes the percentage of data values in each of the nonoverlapping bins.
Step-by-step procedure to obtain frequency data using EXCEL:
- Select A1:B101.
- Select Insert > PivotTable.
- Under Select a table or range, enter “$A$1:$A$101” in Table/Range.
- Click OK.
- Drag Where do you live now? to Rows.
- Drag Where do you live now? to ∑ Values.
- Click on Where do you live now? in ∑ Values.
- Select Value Field Settings.
- In Summarize value field by, choose Count and click OK.
- Now, click on Where do you live now? and Count of Where do you live now? in Drag fields between areas below and Remove Field.
- Drag What do you consider to be the ideal community? to Rows.
- Drag What do you consider to be the ideal community? to ∑ Values.
- Click on What do you consider to be the ideal community? in ∑ Values.
- Select Value Field Settings.
- In Summarize value field by, choose Count and click OK.
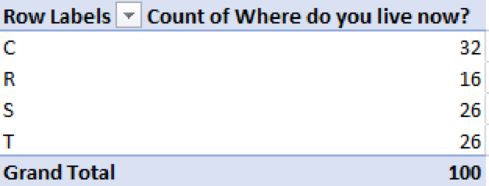
Outputs obtained is as follows:
The percent frequency distribution for each question is computed as follows:
Where do you live now?
| Living area | Frequency | Percent frequency |
| C | 32 | |
| R | 16 | |
| S | 26 | |
| T | 26 | |
| Total | 100 | 100 |
What do you consider to be the ideal community?
| Living area | Frequency | Percent frequency |
| C | 24 | |
| R | 21 | |
| S | 25 | |
| T | 30 | |
| Total | 100 | 100 |
Step-by-step procedure to plot histogram using EXCEL:
- Select Insert.
- Choose Insert Column or Bar Chart under Charts.
- In Series Options, enter Gap Width as 0%.
Similarly, the histogram for the other question also obtained.
Thus, the percent frequency distribution and histogram are obtained.
b.
Find the community where most adults are living now.
Answer to Problem 8P
The most adults are living in City (C).
Explanation of Solution
From Part (a), it is clear that for the question “Where do you live now?”, the percent frequency for City (C) is 32, which is highest when compared to other community.
Therefore, the most adults are living in City (C).
c.
Find the community where most adults consider the ideal community to be.
Answer to Problem 8P
The community where most adults consider the ideal community is Small Town (T).
Explanation of Solution
From Part (a), it is clear that for the question “What do you consider to be the ideal community?”, the percent frequency for Small Town (T) is 30, which is highest when compared to other community.
Therefore, the most adults are living in Small Town (T).
d.
Explain the expected changes in living areas if people moved from where they currently live to their ideal community.
Explanation of Solution
The percent frequency distribution is obtained in Part (a). The difference between the percent frequencies for ideal community and currently living community is computed as follows:
| Living area | Living now | Ideal community | Difference |
| C | 32 | 24 | |
| R | 16 | 21 | |
| S | 26 | 25 | |
| T | 26 | 30 |
It is clear that there is no substantial change in Suburb living (S). However, the difference in percent between ideal community and currently living community is high for Small Town (T) and Rural (R). Hence, it would be expected that living in City (C) would decline, whereas, living in Small Towns (T) and Rural (R) would increase.
Want to see more full solutions like this?
Chapter 2 Solutions
Essentials of Business Analytics (MindTap Course List)


 MATLAB: An Introduction with ApplicationsStatisticsISBN:9781119256830Author:Amos GilatPublisher:John Wiley & Sons Inc
 Probability and Statistics for Engineering and th...StatisticsISBN:9781305251809Author:Jay L. DevorePublisher:Cengage Learning
 Statistics for The Behavioral Sciences (MindTap C...StatisticsISBN:9781305504912Author:Frederick J Gravetter, Larry B. WallnauPublisher:Cengage Learning
 Elementary Statistics: Picturing the World (7th E...StatisticsISBN:9780134683416Author:Ron Larson, Betsy FarberPublisher:PEARSON
 The Basic Practice of StatisticsStatisticsISBN:9781319042578Author:David S. Moore, William I. Notz, Michael A. FlignerPublisher:W. H. Freeman
 Introduction to the Practice of StatisticsStatisticsISBN:9781319013387Author:David S. Moore, George P. McCabe, Bruce A. CraigPublisher:W. H. Freeman