Concept explainers
Videos
Figure P2.1 shows a motion diagram of a car traveling down a street. The camera took one frame every second. A distance scale is provided.
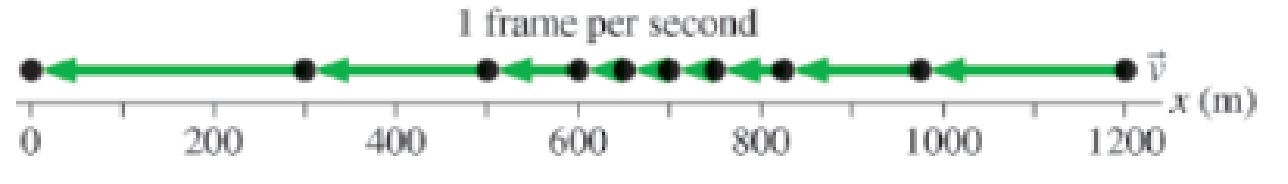
Figure P2.1
a. Measure the x-value of the car at each dot. Place your data in a table, similar to Table 2.1, showing each position and the instant of time at which it occurred.
b. Make a graph of x versus t, using the data in your table. Because you have data only at certain instants of time, your graph should consist of dots that are not connected together.

Learn your wayIncludes step-by-step video

Chapter 2 Solutions
College Physics: A Strategic Approach (4th Edition)
Additional Science Textbook Solutions
Physics (5th Edition)
College Physics (10th Edition)
An Introduction to Thermal Physics
Life in the Universe (4th Edition)
Essential University Physics (3rd Edition)
Conceptual Physical Science (6th Edition)


- An object is at x = 0 at t = 0 and moves along the x axis according to the velocitytime graph in Figure P2.40. (a) What is the objects acceleration between 0 and 4.0 s? (b) What is the objects acceleration between 4.0 s and 9.0 s? (c) What is the objects acceleration between 13.0 s and 18.0 s? (d) At what time(s) is the object moving with the lowest speed? (e) At what time is the object farthest from x = 0? (f) What is the final position x of the object at t = 18.0 s? (g) Through what total distance has the object moved between t = 0 and t = 18.0 s? Figure P2.40arrow_forwardA student drives a moped along a straight road as described by the velocitytime graph in Figure P2.32. Sketch this graph in the middle of a sheet of graph paper. (a) Directly above your graph, sketch a graph of the position versus time, aligning the time coordinates of the two graphs. (b) Sketch a graph of the acceleration versus time directly below the velocitytime graph, again aligning the time coordinates. On each graph, show the numerical values of x and ax for all points of inflection. (c) What is the acceleration at t = 6.00 s? (d) Find the position (relative to the starting point) at t = 6.00 s. (e) What is the mopeds final position at t = 9.00 s? Figure P2.32arrow_forwardA student drives a moped along a straight road as described by the velocity-versus-time graph in Figure P2.12. Sketch this graph in the middle of a sheet of graph paper. (a) Directly above your graph, sketch a graph of the position versus time, aligning the time coordinates of the two graphs. (b) Sketch a graph of the acceleration versus time directly below the velocity-versus-time graph, again aligning the time coordinates. On each graph, show the numerical values of x and ax for all points of inflection. (c) What is the acceleration at t = 6.00 s? (d) Find the position (relative to the starting point) at t = 6.00 s. (e) What is the mopeds final position at t = 9.00 s? Figure P2.12arrow_forward
- The Acela is an electric train on the Washington-New YorkBoston run, carrying passengers at 170 mi/h. A velocity-time graph for the Acela is shown in Figure P2.69. (a) Describe the train's motion in each successive lime interval, (b) Find the trains peak positive acceleration in the motion graphed, (c) Find the trains displacement in miles between t = 0 and t = 200 s.arrow_forwardThe Acela is an electric train on the WashingtonNew YorkBoston run, carrying passengers at 170 mi/h. A velocitytime graph for the Acela is shown in Figure P2.46. (a) Describe the trains motion in each successive time interval. (b) Find the trains peak positive acceleration in the motion graphed. (c) Find the trains displacement in miles between t = 0 and t = 200 s. Figure P2.46 Velocity versus time graph for the Acela.arrow_forwardStanding at the base of one of the cliffs of Mt. Arapiles in Victoria, Australia, a hiker hears a rock break loose from a height of 105 m. He can't see the rock right away but then does, 1.50 s later. (a) How far above the hiker is the rock when he can see it? (b) How much time does he have to move before the rock hits his head?arrow_forward
- Figure P2.15 shows a graph of vx versus t for the motion of a motorcyclist as he starts from rest and moves along the road in a straight line. (a) Find the average acceleration for the time interval t = 0 to t = 6.00 s. (b) Estimate the time at which the acceleration has its greatest positive value and the value of the acceleration at that instant. (c) When is the acceleration zero? (d) Estimate the maximum negative value of the acceleration and the time at which it occurs. Figure P2.15arrow_forwardA glider of length moves through a stationary photogate on an air track. A photogate (Fig. P2.44) is a device that measures the time interval td during which the glider blocks a beam of infrared light passing across the photogate. The ratio vd = /td is the average velocity of the glider over this part of its motion. Suppose the glider moves with constant acceleration. (a) Argue for or against the idea that vd is equal to the instantaneous velocity of the glider when it is halfway through the photogate in space. (b) Argue for or against the idea that vd is equal to the instantaneous velocity of the glider when it is halfway through the photogate in time.arrow_forwardAt the end of a race, a runner decelerates from a velocity of 9.00 m/s at a rate of 2.00 m/s2. (a) How far does she travel in the next 5.00 s? (b) What is her final velocity? (c) Evaluate the result. Does it make sense?arrow_forward
- A glider of length moves through a stationary photogate on an air track. A photogate (Fig. P2.19) is a device that measures the time interval td during which the glider blocks a beam of infrared light passing across the photogate. The ratio vd = /td is the average velocity of the glider over this part of its motion. Suppose the glider moves with constant acceleration. (a) Argue for or against the idea that vd is equal to the instantaneous velocity of the glider when it is halfway through the photogate in space. (b) Argue for or against the idea that vd is equal to the instantaneous velocity of the glider when it is halfway through the photogate in time. Figure P2.19arrow_forwardA cyclist rides 8.0 km east for 20 minutes, then he turns and heads west for 8 minutes and 3.2 km. Finally, he rides east for 16 km, which takes 40 minutes. (a) What is the final displacement of the cyclist? (b) What is his average velocity?arrow_forwardA car goes 78 m to the righty and then 22 m to the left. It makes this trip on 35 seconds. a. What is the displacement in meters? b. What is the total distance travelled in meters? c. What is the average velocity? d. What is the average speed in m/s?arrow_forward
 Principles of Physics: A Calculus-Based TextPhysicsISBN:9781133104261Author:Raymond A. Serway, John W. JewettPublisher:Cengage Learning
 Physics for Scientists and Engineers with Modern ...PhysicsISBN:9781337553292Author:Raymond A. Serway, John W. JewettPublisher:Cengage Learning
 Physics for Scientists and EngineersPhysicsISBN:9781337553278Author:Raymond A. Serway, John W. JewettPublisher:Cengage Learning
 Physics for Scientists and Engineers: Foundations...PhysicsISBN:9781133939146Author:Katz, Debora M.Publisher:Cengage Learning
 Physics for Scientists and Engineers, Technology ...PhysicsISBN:9781305116399Author:Raymond A. Serway, John W. JewettPublisher:Cengage Learning
 College PhysicsPhysicsISBN:9781938168000Author:Paul Peter Urone, Roger HinrichsPublisher:OpenStax College