
Concept explainers
Videos
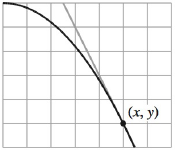
Approximating the Slope of a Graph In Exercises 1-4, approximate the slope of the graph at the point (x, y). (Each square on the grid is 1 unit by 1 unit.)
To calculate: The slope of the provided graph at the given point
The provided graph is shown below,

Answer to Problem 1RE
Solution:
The slope of the given curve at point
Explanation of Solution
Given Information:
The provided graph is shown below,
Each grid in the curve represents 1 unit by 1 unit as dimensions
Formula used:
Consider the equation of the given curve as
Here
Calculation:
The change in y is 4 units decreasing for 2 unit increase in x direction.
Hence, using formula for the slope of a function,
Here
The slope of the given graph is,
Now, as there is a decrease of 2 units in y as per increase in a unit of x
Therefore, the slope at point
Want to see more full solutions like this?
Chapter 2 Solutions
BUNDLE: CALCULUS: AN APPLIED APPROACH


- Sketching a Line In Exercises 11-16, sketch the line that you think best approximates the data in the scatter plot. Then find an equation of the line. To print an enlarged copy of the graph, go to MathGraphs.com.arrow_forwardSketching the Graph of an Equation In Exercises 1 and 2, construct a table of values that consists of several solution points of the equation. Use the resulting solution points to sketch the graph of the equation. y=x2+2xarrow_forward
 Trigonometry (MindTap Course List)TrigonometryISBN:9781337278461Author:Ron LarsonPublisher:Cengage Learning