EBK PRINCIPLES OF GEOTECHNICAL ENGINEER
9th Edition
ISBN: 9781337517218
Author: SOBHAN
Publisher: VST
expand_more
expand_more
format_list_bulleted
Concept explainers
Videos
Textbook Question
Chapter 2, Problem 2.10P
Repeat Problem 2.8 using the following data.
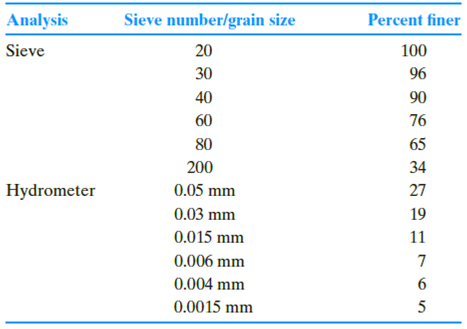
2.8 The following are the results of a sieve and hydrometer analysis.
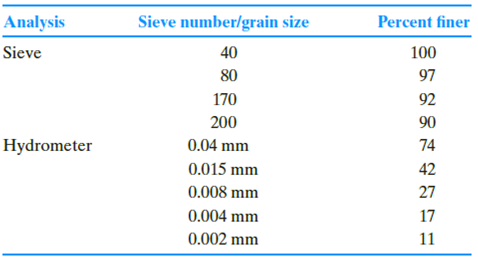
a. Draw the grain-size distribution curve.
b. Determine the percentages of gravel, sand, silt and clay according to the MIT system.
c. Repeat Part b according to the USDA system.
d. Repeat Part b according to the AASHTO system.
Expert Solution & Answer

Trending nowThis is a popular solution!

Students have asked these similar questions
5. The results of a particle size analysis of a soil are given in the following table. The Atterberg
limit tests yielded LL=62, PL = 20.
Sieve Opening (mm)
Percent Coarser by Weight
Sieve No.
4.75
5.1
10
2.00
10.0
20
0.85
0.425
40.7
40
70.2
84.8
90.5
60
0.25
100
0.15
200
Pan
0.075
100
a) Draw the gradation curve for this soil
b) Determine the uniformity coefficient and the coefficient of curvature
c) Classify the soil using USCS and ASSHTO
d) Rate this soil as a subgrade for highway construction
Q3
The results of a particle size analysis of a soil are given in the following
Table. No Atterberg limit tests were conducted.
Sieve No.
Percent finer
No.40 No.100 | No.200
49.8
No.4
No.10 No.20
70.2
62.5
9.53 mm
100
89.8
28.6
4.1
a) Would you have conducted Atterberg limit tests on this soil? Justify your
answer.
b) Classify the soil according to USCS and AASHTO.
c) Is this soil a good foundation material? Justify your answer
The results of the sieve analysis done on a soil are shown below.
Sieve No.
Diameter
Soil A
4
4.760
89
6
2.380
70
10
2.000
63
20
0.840
55
40
0.420
40
60
0.250
31
100
0.149
20
200
0.074
4
LL
60
PL
40
Determine its classification using USCS.
SW
None of the above
GW
SP
GP
Chapter 2 Solutions
EBK PRINCIPLES OF GEOTECHNICAL ENGINEER
Ch. 2 - For a gravel with D60 = 0.48 mm, D30 = 0.25 mm,...Ch. 2 - Prob. 2.2PCh. 2 - Prob. 2.3PCh. 2 - The following are the results of a sieve analysis....Ch. 2 - Repeat Problem 2.4 with the following data. 2.4...Ch. 2 - Repeat Problem 2.4 with the following data. 2.4...Ch. 2 - Repeat Problem 2.4 with the following data. 2.4...Ch. 2 - The following are the results of a sieve and...Ch. 2 - Repeat Problem 2.8 using the following data. 2.8...Ch. 2 - Repeat Problem 2.8 using the following data. 2.8...
Ch. 2 - The grain-size characteristics of a soil are given...Ch. 2 - Repeat Problem 2.11 with the following data. 2.11...Ch. 2 - Repeat Problem 2.11 with the following data. 2.11...Ch. 2 - A hydrometer test has the following result: Gs =...Ch. 2 - Repeat Problem 2.14 with the following values: Gs...Ch. 2 - Three groups of students from the Geotechnical...Ch. 2 - Refer to Problem 2.C.1. Results of the sieve...
Knowledge Booster


Learn more about
Need a deep-dive on the concept behind this application? Look no further. Learn more about this topic, civil-engineering and related others by exploring similar questions and additional content below.Similar questions
- Compute for the percent gravel, sand and finer as per USCS-ASTM A soil specimen (SOIL A) was subjected to mechanical analysis via sieve analysis experiment. Make the necessary calculations and draw the particle distribution curve. Sieve # Mass of Soil on each Sieve Sieve Opening Size 4 4.75 10 54 20 65 0.85 40 60 0.425 60 127 0.25 80 186 0.18 100 150 0.15 200 89 0..075 PAN 27 n/aarrow_forwardThe following are the results of a sieve and hydrometer analysis. Analysis Sieve number/grain size Percent finer Sieve 40 100 80 97 170 92 200 90 Hydrometer 0.04 mm 74 0.015 mm 42 0.008 mm 27 0.004 mm 17 0.002 mm 11 a. Draw the grain-size distribution curve. b. Determine the percentages of gravel, sand, silt and clay according to the MIT system. c. Repeat Part b according to the USDA system. d. Repeat Part b according to the AASHTO system.arrow_forwardComplete the table below and determine the percentages of gravel, sand, silt, and clay based on MIT, AASHTO, USDA, and USCS. Use logarithmic interpolation if needed. SIEVE SIZE (mm) 0.25 0.149 0.074 0.052 0.02 0.01 0.004 0.001 Pan WEIGHT RETAINED 18.96 33.18 45.03 54.51 42.66 11.85 4.74 4.74 21.33 CUMULATIVE WEIGHT RETAINED PERCENT PASSINGarrow_forward
- The following data are the results of a sieve analysis. Determine the percentage of silt and clay combined using Unified Classification System. Mass of soil Sieve no. Opening retained (mm) on each sieve 4 4.75 21.5 10 2 18.5 20 0.85 53.2 40 0.425 90.5 60 0.25 81.8 100 0.15 92.2 200 0.075 58.5 Pan 26.5 Select one: O a. 6 b. 19 c. 58 d. 17 e. none of the choicesarrow_forwardThe following data are the results of a sieve analysis. Determine the percentage of silt and clay combined using Unified Classification System. Mass of soil Sieve no. Opening retained (mm) on each sieve 4 4.75 21.5 10 2 18.5 20 0.85 53.2 40 0.425 90.5 60 0.25 81.8 100 0.15 92.2 200 0.075 58.5 Pan 26.5 Select one: а. 19 b. none of the choices С. 6 d. 17 e. 58arrow_forward200 pan 44 22arrow_forward
- The results of the sieve analysis done on a soil are shown below. Sieve No. Diameter Soil A 4 4.760 89 6 2.380 70 10 2.000 63 20 0.840 55 40 0.420 40 60 0.250 31 100 0.149 20 200 0.074 4 LL 60 PL 40 Determine its classification using USCS.arrow_forward2.8 2.7 The following are the results of a sieve and hydrometer analysis. Sieve number/ grain size Analysis Sieve Hydrometer Analysis Sieve 40 80 170 200 0.04 mm 0.02 mm 0.01 mm 0.005 mm 0.0015 mm Hydrometer Sieve number/ grain size Percent finer than a. Draw the grain-size distribution curve. b. Determine the percentages of gravel, sand, silt, and clay according to the MIT system. c. Repeat Part b according to the USDA system. d. Repeat Part b according to the AASHTO system. Repeat Problem 2.7 with the following data: 20 30 40 60 80 200 0.05 mm 0.03 mm 0.015 mm 0.006 mm 0.004 mm 0.0015 mm 100 96 85 80 59 39 26 15 8 Cengage Learning 2014 Percent finer than 100 96 90 76 65 34 27 19 11 7 6 5 Ⓒ Cengage Learning 2014arrow_forwardQuestion 44 The given data shows a sieve analysis of a soil sample. Classify the soil using AASHTO Method. Tables are provided below. Sieve No. Diameter (mm) Percent Passing No 4 4.760 99 No. 8 2.380 91 No. 10 2.000 90 No. 20 0.840 85 No. 40 0.420 81 No. 60 0.250 79 No. 100 0.150 67 No. 200 0.075 60 Characteristics of No. 40 Fraction LL 39 PL 32 General classification Granular materials (35% or less of total sample passing No. 200) A-1 A-2 Group classification Sieve analysis (percent passing) No. 10 A-1-a A-1-b A-3 A-2-4 A-2-5 A-2-6 A-2-7 50 max. 30 max. 15 max. No. 40 50 max. 25 max. 51 min. 10 max. No. 200 35 max. 35 max. 35 max. 35 max. Characteristics of fraction passing No. 40 Liquid limit Plasticity index 40 max. 10 max. 41 min. 40 max. 11 min. 41 min. 11 min. 6 max. NP 10 max. Usual types of significant constituent Stone fragments, gravel, and sand Fine Silty or clayey gravel and sand sand materials ESC F4 FS F6 F7 FB F9 & 61 A4TECH Y P G J K 国 因arrow_forward
- Question 44 The given data shows a sieve analysis of a soil sample. Classify the soil using AASHTO Method. Tables are provided below. Sieve No. Diameter (mm) Percent Passing No. 4 No. 8 No. 10 No. 20 4.760 96 2.380 80 2.000 78 0.840 61 No. 40 0.420 56 No. 60 0.250 48 No. 100 0.150 39 No. 200 0.075 33 Characteristics of No. 40 Fraction LL 45 PL 36 General classification Granular materials (35% or less of total sample passing No. 200) A-I A-2 Group classification A-l-a A-1-5 A3 A-24 A-25 A-2-6 A-2-7 Sieve analysis (percent passing) No. 10 No. 40 No. 200 50 max. 30 max. 15 max. 50 max. 25 max. 51 min. 10 max. 35 max. 35 max. 35 max. 35 max. Characteristics of fraction passing No. 40 Liquid limit Plasticity index 40 max. 41 min. 40 max. 41 min. 6 max. NP 10 max. 10 max. 11 min. 11 min. Usual types of significant Stone fragments, gravel, and sand Fine Silty or clayey gravel and sand sandarrow_forwardThe following are the results of a sieve and hydrometer analysis: Sieve number/ Percent finer than Analysis grain size Sieve 20 100 30 96 40 90 60 76 80 65 200 34 Hydrometer 0.05 mm 27 0.03 mm 19 0.015 mm 0.006 mm 7 0.004 mm 0.0015 mm 5 a. Draw the grain-size distribution curve. b. Determine the percentages of gravel, sand, silt, and clay according to the MIT system. c. Determine the percentages of gravel, sand, silt, and clay according to the USDA system. d. Determine the percentages of gravel, sand, silt, and clay according to the AASHTO system.arrow_forwardThe following are the results of a sieve analysis: a. Determine the percent finer than each sieve and plot a grain-size distributioncurve. b. Determine D10, D30, and D60from the grain-size distribution curve. c. Calculate the Cu and Cc Please kindly solve a, b and c... Help me urgent Thank youarrow_forward
arrow_back_ios
SEE MORE QUESTIONS
arrow_forward_ios
Recommended textbooks for you
 Principles of Geotechnical Engineering (MindTap C...Civil EngineeringISBN:9781305970939Author:Braja M. Das, Khaled SobhanPublisher:Cengage Learning
Principles of Geotechnical Engineering (MindTap C...
Civil Engineering
ISBN:9781305970939
Author:Braja M. Das, Khaled Sobhan
Publisher:Cengage Learning
How Are Highways Designed?; Author: Practical Engineering;https://www.youtube.com/watch?v=9XIjqdk69O4;License: Standard Youtube License