
EBK PRINCIPLES OF GEOTECHNICAL ENGINEER
9th Edition
ISBN: 9781337517218
Author: SOBHAN
Publisher: VST
expand_more
expand_more
format_list_bulleted
Concept explainers
Videos
Textbook Question
Chapter 2, Problem 2.14P
A hydrometer test has the following result: Gs = 2.65, temperature of water = 26° C, and L = 10.4 cm at 45 minutes after the start of sedimentation (see Figure 2.25). What is the diameter D of the smallest-size particles that have settled beyond the zone of measurement at that time (that is, t = 45 min)?
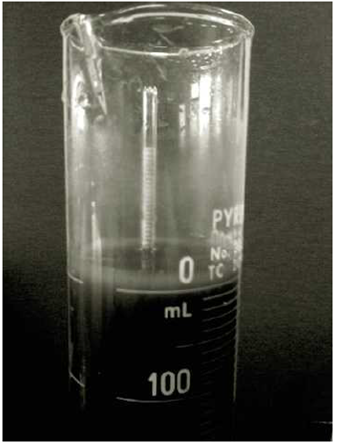
Figure 2.25 ASTM 152H type of hydrometer placed inside the sedimentation cylinder (Courtesy of Khaled Sobhan, Florida Atlantic University, Boca Raton, Florida)
Expert Solution & Answer

Trending nowThis is a popular solution!

Students have asked these similar questions
In a hydrometer test, the results are as follows: Gs=2.85 ; Temperature of water=86 degree Fahrenheit, and R=33 at 2.5 hours after the start of sedimentation . What is the diameter, d, of the smallest-size particles that have settled beyond the zone of measurement at that time?
Please answer this asap. For upvote. Thank you very much
A hydrometer test has the following result: Gs = 2.75, temperature of water = 23°C,
and L = 12.8 cm at 100 minutes after the start of sedimentation (see Figure 1.5).
What is the diameter D of the smallest-size particles that have settled beyond the
zone of measurement at that time (that is, † = 100 min)?
In a hydrometer test, the results are as follows:
Gs=2.55
Temperature of water=25 degree Celsius,
and R=41 at 2 hours after the start of sedimentation.
What is the diameter, d, of the smallest-size particles that have settled beyond the zone of measurement at that time?
Please answer this asap
Chapter 2 Solutions
EBK PRINCIPLES OF GEOTECHNICAL ENGINEER
Ch. 2 - For a gravel with D60 = 0.48 mm, D30 = 0.25 mm,...Ch. 2 - Prob. 2.2PCh. 2 - Prob. 2.3PCh. 2 - The following are the results of a sieve analysis....Ch. 2 - Repeat Problem 2.4 with the following data. 2.4...Ch. 2 - Repeat Problem 2.4 with the following data. 2.4...Ch. 2 - Repeat Problem 2.4 with the following data. 2.4...Ch. 2 - The following are the results of a sieve and...Ch. 2 - Repeat Problem 2.8 using the following data. 2.8...Ch. 2 - Repeat Problem 2.8 using the following data. 2.8...
Ch. 2 - The grain-size characteristics of a soil are given...Ch. 2 - Repeat Problem 2.11 with the following data. 2.11...Ch. 2 - Repeat Problem 2.11 with the following data. 2.11...Ch. 2 - A hydrometer test has the following result: Gs =...Ch. 2 - Repeat Problem 2.14 with the following values: Gs...Ch. 2 - Three groups of students from the Geotechnical...Ch. 2 - Refer to Problem 2.C.1. Results of the sieve...
Knowledge Booster


Learn more about
Need a deep-dive on the concept behind this application? Look no further. Learn more about this topic, civil-engineering and related others by exploring similar questions and additional content below.Similar questions
- Repeat Problem 2.14 with the following values: Gs = 2.75, temperature of water = 21C, t = 88 min, and L = 11.7 cm. 2.14 A hydrometer test has the following result: Gs = 2.65, temperature of water = 26 C, and L = 10.4 cm at 45 minutes after the start of sedimentation (see Figure 2.25). What is the diameter D of the smallest-size particles that have settled beyond the zone of measurement at that time (that is, t = 45 min)? Figure 2.25 ASTM 152H type of hydrometer placed inside the sedimentation cylinder (Courtesy of Khaled Sobhan, Florida Atlantic University, Boca Raton, Florida)arrow_forwardA column analysis of a flocculating suspension is shown below. The initial solids concentration is 200 mg/L. The resulting matrix is given in Table 3. Table 3: Concentrated solids measured (mg/L) for a flocculent settlement column test. Time of sampling (minutes) Depth (m) 0.5 1 1.5 2 2.5 3 (a). 30 135 181 202 215 218 227 60 85 123 149 U 167 177 189 80% 90 53 92 120 133 143 157 Calculate the removal fraction at each depth and time. 120 40 64 95 111 121 134 70% 150 31 54 71 (b). Based on the isoremoval flocculent sedimentation diagram given in Appendix 2, calculate the overall removal efficiency of a settling basin which is 3 meters deep with a detention time of 1 hour and 45 minutes. 1. 92 105 115 Scanned with AnyScanner O L 60% 2.5 50% 40% -20% 51 180 25 45 55 67 83 97 30% 10% S 1₂ 150 120 06 09 O 3 Time. minarrow_forwardA carefully-weighed 57.6 gram soil sample was dispersed for particle-size analysis using the Bouyoucos hydrometer method. The laboratory was held at a constant temperature of 20 C (68 F). The hydrometer reading after 40 seconds was 21.3 and the hydrometer reading after 8 hours was 17.0. How many grams of particles in the sample were either silt-sized or clay-sized? Your Answer: Answer unitsarrow_forward
- A carefully-weighed 45.3 gram soil sample was dispersed for particle-size analysis using the Bouyoucos hydrometer method. The laboratory was held at a constant temperature of 20 C (68 F). The hydrometer reading after 40 seconds was 20.8 and the hydrometer reading after 8 hours was 12.1. How many grams of particles in the soil sample were silt-sized? Your Answer: Answer unitsarrow_forwardA constant head permeameter, 85 mm in diameter containing fine sand sample 450 mm long, allowed water to flow at a rate of 184 mL/min under steady flow conditions. Given the difference in head between two points 240 mm apart was 375 mm, determine the coefficient of permeability in mm/s. When the same sample size is tested in a falling head apparatus using a stand-pipe of 32.5 mm diameter, calculate the time required for the water in the stand-pipe to drop from 1750 mm to 1000 mm above the outflow level.arrow_forwardQUESTION 2 a. The results given in Table 1 were obtained in a particle size distribution test for soil sample received in the laboratory. Table 1 US Sieve No. Size Opening(mm) Weight Retained(g) 4 4.75 0 10 2.0 18.5 20 0.85 53.2 40 0.425 90.5 60 0.25 81.8 100 0.150 92.2 200 0.075 58.5 Pan - 26.5i. Determine the percentage passing each sieve and plot the particle size distribution curve. ii. How much fine-grained soils are in the sample ? iii. Determine the amount of gravel and sand in the sample ? iv. Determine D10, D30, and D60 from the grain-size distribution curve. v. Calculate the uniformity coefficient, Cu. vi. Calculate the coefficient of gradation, Cc. vii. Describe the gradation curve (eg poorly graded)arrow_forward
- Please answer all 1. List the three corrections which should be applied to the hydrometer readings. 2. Why is it important to remove the hydrometer from the measuring cylinder between readings? 3. A hydrometer test has the following results; Gs = 2.70, temperature = 240C, and L = 92 mm at 60 minutes after the start of sedimentation. Calculate the diameter of the smallest-size particles that have settled beyond the zone of measurement at that time (use the table in the lab manual to find, A=0.0128). D(mm) = A sqrt( L(cm) / t(min) )arrow_forwardI need the the answer as soon as possiblearrow_forwardProblem A liquid limit test conducted on a soil sample in the cup device gave the following results: N 10 19 23 27 40 w (%) 60.0 45.3 39.8 36.5 25.2 The plastic limit test and natural water content. Plastic Limit Natural Water Content Test Test No. Weight of Container + Lid (g) 2 1 2 13.07 13.18 7.84 7.5 Weight of Container + Lid + Wet Soil (g) 22.12 21.84 17.53 16.97 Weight of Container + Lid + Dry Soil (g) 20.59 20.35 15.45 14.93 The shrinkage limit test. Weight of Dish with petroleum jelly (g) Weight of Dish with petroleum jelly+ Wet Soil (g) Weight of Dish with petroleum jely + Dry Soil (g) Volume of Shrinkage Dish (cm³) Volume of Oven-Dried Soil Pat (cm?) 11.3 38.51 32.81 15.26 12.83 8. Determine the liquid limit. b. 39% 9. Determine the plastic limit. a. 38% C. 37% d. 40% b. 21.20% 10. Determine the shrinkage limit. 20.55% C. 21.85% d. 20.20% a. a. 15.20% b. 22.40% C. 18.59% d. 16.45%arrow_forward
- 2.9 and 3.1arrow_forwardA cylindrical soil sample 50 mm in diameter and 200 mm in height is used as thepermeameter in a falling head permeability test setup. In one minute of observation, thehydraulic head in the 10 mm diameter standpipe through which test water went reducedfrom 900mm to 500 mm. During that time, 1.5 liters of water were collected in the graduate. Calculate the soil sample's permeability coefficient in cm/s.arrow_forwardNo explanation needed, answer asap please . Thank youarrow_forward
arrow_back_ios
SEE MORE QUESTIONS
arrow_forward_ios
Recommended textbooks for you
 Principles of Geotechnical Engineering (MindTap C...Civil EngineeringISBN:9781305970939Author:Braja M. Das, Khaled SobhanPublisher:Cengage Learning
Principles of Geotechnical Engineering (MindTap C...
Civil Engineering
ISBN:9781305970939
Author:Braja M. Das, Khaled Sobhan
Publisher:Cengage Learning
Hydrogen - the Fuel of the Future?; Author: Real Engineering;https://www.youtube.com/watch?v=iPheEg-K2qc;License: Standard Youtube License