
Principles of Geotechnical Engineering (MindTap Course List)
9th Edition
ISBN: 9781305970939
Author: Braja M. Das, Khaled Sobhan
Publisher: Cengage Learning
expand_more
expand_more
format_list_bulleted
Concept explainers
Videos
Textbook Question
Chapter 2, Problem 2.15P
Repeat Problem 2.14 with the following values: Gs = 2.75, temperature of water = 21°C, t = 88 min, and L = 11.7 cm.
2.14 A hydrometer test has the following result: Gs = 2.65, temperature of water = 26° C, and L = 10.4 cm at 45 minutes after the start of sedimentation (see Figure 2.25). What is the diameter D of the smallest-size particles that have settled beyond the zone of measurement at that time (that is, t = 45 min)?
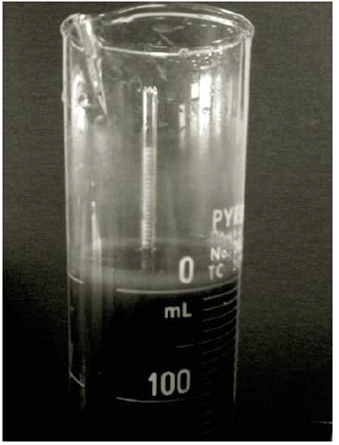
Figure 2.25 ASTM 152H type of hydrometer placed inside the sedimentation cylinder (Courtesy of Khaled Sobhan, Florida Atlantic University, Boca Raton, Florida)
Expert Solution & Answer

Trending nowThis is a popular solution!

Students have asked these similar questions
In a hydrometer test, the results are as follows: Gs = 2.60, temperature of water = 24°C, R = 43 (K= 0.0132, L =9.2 cm) at 60 mins after the start of sedimentation. What is the diameter D, of the smallest-size particles that have settled beyond the zone of measurement at that time (that is, t = 60 min.)?
Please answer all
1. List the three corrections which should be applied to the hydrometer readings.
2. Why is it important to remove the hydrometer from the measuring cylinder between readings?
3. A hydrometer test has the following results; Gs = 2.70, temperature = 240C, and L = 92 mm at 60 minutes after the start of sedimentation. Calculate the diameter of the smallest-size particles that have settled beyond the zone of measurement at that time (use the table in the lab manual to find, A=0.0128).
D(mm) = A sqrt( L(cm) / t(min) )
Opening(mm)
Mass of soil retained on each sieve (g)
4.75
18.0
2
22.0
0.85
40.0
0.425
22.0
0.25
27.0
0.15
30.0
0.075
12.0
0.02
29.0
0.006
21.0
Pan
30.0
Based on this result, plot the particle-size distribution curve and determine the following:i) The percentage passing for each of the sieve size.ii) D10, D30 and D60 from the particle-size distribution curve.iii) The uniformity of coefficient, Cu and the coefficient of gradation, Cc.iv) Classify the soil using the British Standard Soil Classification System if the liquid limitand plasticity limit of the soil are 63% and 22%.
Refer Figure 1
Chapter 2 Solutions
Principles of Geotechnical Engineering (MindTap Course List)
Ch. 2 - For a gravel with D60 = 0.48 mm, D30 = 0.25 mm,...Ch. 2 - Prob. 2.2PCh. 2 - Prob. 2.3PCh. 2 - The following are the results of a sieve analysis....Ch. 2 - Repeat Problem 2.4 with the following data. 2.4...Ch. 2 - Repeat Problem 2.4 with the following data. 2.4...Ch. 2 - Repeat Problem 2.4 with the following data. 2.4...Ch. 2 - The following are the results of a sieve and...Ch. 2 - Repeat Problem 2.8 using the following data. 2.8...Ch. 2 - Repeat Problem 2.8 using the following data. 2.8...
Ch. 2 - The grain-size characteristics of a soil are given...Ch. 2 - Repeat Problem 2.11 with the following data. 2.11...Ch. 2 - Repeat Problem 2.11 with the following data. 2.11...Ch. 2 - A hydrometer test has the following result: Gs =...Ch. 2 - Repeat Problem 2.14 with the following values: Gs...Ch. 2 - Three groups of students from the Geotechnical...Ch. 2 - Refer to Problem 2.C.1. Results of the sieve...
Knowledge Booster


Learn more about
Need a deep-dive on the concept behind this application? Look no further. Learn more about this topic, civil-engineering and related others by exploring similar questions and additional content below.Similar questions
- During a constant head permeability test on a sand sample, 260 x 10^3 mm^3 of water were collected in 2 minutes. If the sample had a length of 100 mm, a diameter of 40 mm and a maintained head of 200 mm. What is the coefficient of permeability in mm/s?arrow_forwardA 50 mm diameter and 90 mm-long silty clay sample was subjected to a falling head permeameter test using a setup similar to the one shown in Figure 6.4b, where the inner diameter of the standpipe was 3.0 mm. The head dropped from 870 mm to 450 mm in 5 minutes. What is the permeability of the sample?arrow_forward- Find the moisture content, using dry weight per trial based on the table. - Solve the mean, sd, and rsd of the measurements. Description Trial 1 Trial 2 Trial 3 Trial 4 Weight of empty watch glass (g) 38.1151 38.1474 38.9473 38.7400 Weight of watch glass and soil sample (g) 90.1440 85.7554 86.6980 85.1235 Weight of watch glass and dry soil 67.0170 64.1915 65.1110 63.8859arrow_forward
- Question 30 The data from a falling head test is shown. Diameter of standpipe: 6 cm. Initial Head: 90.4 cm. Duration of test: 18 min. Length of soil sample: 30.35 cm. Diameter of permeameter: 44 cm. If the soil permeability is 0.0038 cm/min, determine the final head (in cm.) of the permeability test. Round off to two decimal places.arrow_forwardA hydrometer test has the following result: Gs = 2.65, temperature of water = 26 C, and L = 10.4 cm at 45 minutes after the start of sedimentation (see Figure 2.25). What is the diameter D of the smallest-size particles that have settled beyond the zone of measurement at that time (that is, t = 45 min)? Figure 2.25 ASTM 152H type of hydrometer placed inside the sedimentation cylinder (Courtesy of Khaled Sobhan, Florida Atlantic University, Boca Raton, Florida)arrow_forwardpls ans soon as posssible During a constant head permeability test on a sand sample, 260ml of water was collected in 2 min. If the sample had a length of 100 mm, a diameter of 40 mm and a maintained head of 200 mm, what is the coefficient of permeability?arrow_forward
- A water treatment plant processes 21,000 cubic meters of water per day. Assume two types of flocculated particles enter the basin. You are asked to evaluate the performance of a rectangular sedimentation basin that has dimensions of depth=4 m, width= 6 m, and length= 40 m. The first type of particles has a settling velocity of 0.5 m/hr and the other type has a settling velocity of 1.8 m/hr. What percent of particles are removed for each of the two types of particles?arrow_forwardThe following results were obtained from sieve analysis of sediment samples A and B.Hydrometer tests were conducted on the materials that passed through sieve 200 for Soils Aand the ratio of clay to silt is 4:1. Plot the particle size distribution curves on the same graph.Determine the effective size d10, average sediment size d50, and compute for the gradationof the sediment mixture σg and gradation coefficient Gr. Sieve no. 4 10 20 40 100 200 pan Opening (mm) 4.75 2.0 0.85 0.425 0.15 0.075 Mass retained (g) Sediment sample A 0.0 20.2 25.7 40.4 18.1 27.2 68.2 Sediment sample B 0.0 48.2 19.6 60.3 37.2 22.1 5.6arrow_forward1. A constant head permeability test is conducted on a certain soil. The diameter of the sample is 7.5 cm, length is 20 cm, and the constant head is 42 cm. The mass of water collected in 64 seconds is 88 grams. Solve for the coefficient of permeability in cm/min.arrow_forward
- The permeability test must be carried out on a soil sample 15 cm long and 8 cm in diameter using the permeameter illustrated below. What is the difference between a variable head permeameter and a constant head permeameter?What is the disadvantage of using the constant head permeameter for all soil types? Which pemeameter is it in the illustration below? Justify your answer.How to calculate the permeability coefficient when the pressure drop is maintained at 30 cm and it takes 2 min and 35 s to collect a volume of water of 200 ml? Is it possible to identify the soil from this result? If so, what soil is it?arrow_forwardThe following data are for a falling-head permeability test: Length of the soil sample = 140 mm Diameter of the soil sample = 70 mm Area of the standpipe = 19.6 mm2 At time t =0, head difference = 500 mm At time t = 7 minutes, head difference = 350 mmarrow_forwardA liquid limit test performed on a soil sample has the following results, compute for the value of the flow index. No. of blows Moisture content 20 40.8% 28 39.1%arrow_forward
arrow_back_ios
SEE MORE QUESTIONS
arrow_forward_ios
Recommended textbooks for you
 Principles of Geotechnical Engineering (MindTap C...Civil EngineeringISBN:9781305970939Author:Braja M. Das, Khaled SobhanPublisher:Cengage Learning
Principles of Geotechnical Engineering (MindTap C...
Civil Engineering
ISBN:9781305970939
Author:Braja M. Das, Khaled Sobhan
Publisher:Cengage Learning
Hydrogen - the Fuel of the Future?; Author: Real Engineering;https://www.youtube.com/watch?v=iPheEg-K2qc;License: Standard Youtube License