
Concept explainers
Videos
Using a random number generator create a sample of four relative densities using the PDF presented in Figure 2.2. Repeat the exercise to create three different sample sets. Compute the mean and standard deviation of your sample. Compute the mean and standard deviation of each sample set. Compare the means and standard deviations of your samples with each other and with the mean and standard deviation of the original distribution. Discuss the differences among the sample sets and the original distribution, including the type of uncertainties you are dealing with. How many samples do you think are needed to reliably determine the mean and standard deviation of the relative density of this particular soil?
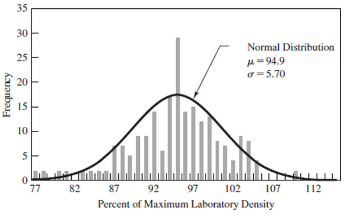
Figure 2.2
Histogram and the corresponding normal distribution of dry unit weight of a compacted soil at a road site in Los Alamos, New Mexico.

Learn your wayIncludes step-by-step video

Chapter 2 Solutions
EBK FOUNDATION DESIGN
Additional Engineering Textbook Solutions
Elementary Surveying: An Introduction To Geomatics (15th Edition)
Elementary Surveying (14th Edition)
Structural Analysis (10th Edition)
Materials for Civil and Construction Engineers (4th Edition)
Concepts Of Programming Languages
Starting Out with Programming Logic and Design (5th Edition) (What's New in Computer Science)


- the allowed discrepancy for the t-test is 2σ. This means that if your result from the t-test is smaller than 2, there is a 95% probability that the two measurements represent the same quantity and therefore, they are consistent with each other.When a set of data is inconsistent, it indicates that Select one: a. The experiment is incorrect and unreliable. b. There was a calculation mistake. c. The uncertainty on the measurements has been overestimated. d. There are some unknown systematic errors in some or all of the measurements.arrow_forwardA population has a mean of u=30 and a standard deviation of sd=5. a. If 5 points were added to every score in the population, what would be the new values for the mean and standard deviation? b. If every score in the population were multiplied by 3, what would be the new values for the mean and standard deviation?arrow_forwardFor computing the variance this number is called as the value that is added or subtracted from the most probable value. O a. Error O b. Accuracy c. Probable Error d. Mistake Clear my choicearrow_forward
- 4. Which of the following is a characteristic of a confidence interval? A. It is constructed using the point estimate, standardized statistic, and standard deviation O B. A higher confidence level results to a narrower interval C. A confidence interval presents a range which shows the only values a point estimate can take. D. A confidence interval of a population will always be consistent. Warrow_forwardMeasurements of the flexible strength of carbon fiber are carried out during the design of a leg prosthesis. After 15 measurements, the mean is calculated as 1725 MPa with a standard deviation of 375 MPa. Previous data on the same material shows a mean of 1740 MPa with a standard deviation of 250 MPa. Use this information to estimate mean and standard deviation of the posterior distribution of the mean. Note: round your answers to only 2 decimals. The mean value of the posterior is type your answer. MPa and the standard deviation is type your answer. MPa.arrow_forwardA certain type of thread is manufactured with a mean tensile strength of 78.3 kg and a standard deviation of 5.6 kg. How is the variance of the sample mean changed when the sample size is a. Increased from 64 to 196? b. Decreased from 784 to 49?arrow_forward
- Find the standard deviation of the following data: Size of items 10 11 12 13 14 Frequency 2 7 11 15 16 1 15 10 4 [Ans.: 1.342]arrow_forwardWhat is the expected error in C in the below equation if you know the random error in A=±34 mm and B=±21.4 mm? C=A+B Answer: Choose... +arrow_forwardThe MPN using the Thomas equation based on the table given below will be: Size of sample (ml) 1 0.1 0.01 0.001 Number of Number of positive negative 5 4 3 0 1 2 3 4arrow_forward
- Use the Poisson distribution to approximate the binomial probability b(1; 100, 0.02).arrow_forward3.. The manufacturer of a patent medicine claimed that it was 90% effective in relieving an allergy for period of 8 hours. He then proves this claim by selecting a simple random sample of allergy patients. To test the legitimacy of the manufacturer's claim, what test of hypothesis should we use? O A. One sample t-Test O B. Two sample t-Test for paired samples O C. Two sample z-Test for proportions D. One sample z-Test for proportionsarrow_forwardDetermine the relative precision of the mean of the measured values shown . Trials 1 2 3 4 5 Length (m) 106.87 106.90 106.93 106.89 106.81arrow_forward

 Structural Analysis (10th Edition)Civil EngineeringISBN:9780134610672Author:Russell C. HibbelerPublisher:PEARSON
 Principles of Foundation Engineering (MindTap Cou...Civil EngineeringISBN:9781337705028Author:Braja M. Das, Nagaratnam SivakuganPublisher:Cengage Learning
 Fundamentals of Structural AnalysisCivil EngineeringISBN:9780073398006Author:Kenneth M. Leet Emeritus, Chia-Ming Uang, Joel LanningPublisher:McGraw-Hill Education
 Traffic and Highway EngineeringCivil EngineeringISBN:9781305156241Author:Garber, Nicholas J.Publisher:Cengage Learning