
a.
To find: The five-number summary for the distribution of revenues for the top global 500
To explain: Why the five-number summary suggests that the distribution is right skewed.
a.
Answer to Problem 2.52E
The five-number summary for the distribution of revenues for the top global 500 is
The difference between the median and minimum is less than the difference between maximum and median in the five-number summary suggests that the distribution is right skewed.
Explanation of Solution
Given info: Table 2.3gives the highest revenues for 30 companies from global 500 companies in 2014.
Calculation:
Five-number summary:
The five-number summary of a distribution consists of minimum, the first
Software procedure:
Step-by-step software procedure for five-number summary using MINITAB software is as follows:
- Choose Stat > Basic Statistics > Display
Descriptive Statistics . - In Variables enter the columns GLOBE500.
- Choose option statistics, and select minimum, first quartile, median, third quartile, maximum.
- Click OK.
Output using MINITAB software is as follows:
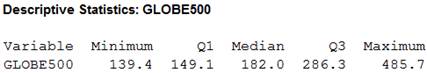
The five-number summary for the distribution of the highest revenues of 30 companies for the top global 500 is
Justification:
The distance from median and minimum is,
The distance from the maximum to the median is,
From the five-number summary, the distribution is right skewed because the difference between the median and minimum is less than the difference between the median and maximum.
b.
To find: The companies which are outliers according to the
To check: Whether the
b.
Answer to Problem 2.52E
According to
Yes, the
Explanation of Solution
Calculation:
From the output in part (a)
The difference between the first quartile and the third quartile is considered as interquartile range.
Thus,
For revenues of 30 companies,
The
A observation is a suspected as outlier if it is more than
The
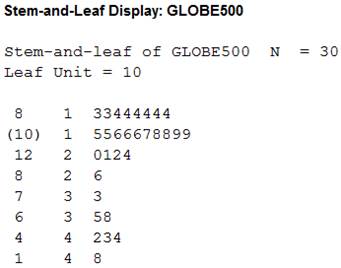
Stemplot:
Software procedure:
Step-by-step software procedure to draw stemplot using MINITAB software is as follows:
- Select Graph>Stem and leaf.
- Select the column of GLOBE500 in Graph variables.
- Select OK.
Output of stemplot is shown below:
Justification:
The stemplot does not show any outliers which indicates that the
c.
To explain: The common feature that the 30 companies in the Table 2.3 share.
To find: The proportion of the total of the global 500 revenues accounted by the 30 companies.
c.
Answer to Problem 2.52E
The common feature that the 30 companies share is that they are the high outliers and have high revenues out of global 500 companies.
The proportion of the total global 500 revenues by the 30 companies is 0.06.
Explanation of Solution
Justification:
From the global 500 companies, 30 companies in Table2.3 have high revenues than the remaining companies, and these 30 companies are the high outliers that has a common feature of sharing.
The proportion of the total global 500 companies accounted by the 30 companies is:
Thus, the proportion of the total global 500 revenues by the 30 companies is 0.06.
Want to see more full solutions like this?
Chapter 2 Solutions
BASIC PRAC OF STATISTICS+LAUNCHPAD+REE

 MATLAB: An Introduction with ApplicationsStatisticsISBN:9781119256830Author:Amos GilatPublisher:John Wiley & Sons Inc
 Probability and Statistics for Engineering and th...StatisticsISBN:9781305251809Author:Jay L. DevorePublisher:Cengage Learning
 Statistics for The Behavioral Sciences (MindTap C...StatisticsISBN:9781305504912Author:Frederick J Gravetter, Larry B. WallnauPublisher:Cengage Learning
 Elementary Statistics: Picturing the World (7th E...StatisticsISBN:9780134683416Author:Ron Larson, Betsy FarberPublisher:PEARSON
 The Basic Practice of StatisticsStatisticsISBN:9781319042578Author:David S. Moore, William I. Notz, Michael A. FlignerPublisher:W. H. Freeman
 Introduction to the Practice of StatisticsStatisticsISBN:9781319013387Author:David S. Moore, George P. McCabe, Bruce A. CraigPublisher:W. H. Freeman