
Concept explainers
Videos
The Consumer Financial Protection Bureau reports on consumer financial product and service complaint submissions by state, category, and company. The following table, stored in FinancialComplaints1, represents complaints, represents complaints received from Louisiana consumer by complaint category for 2016.
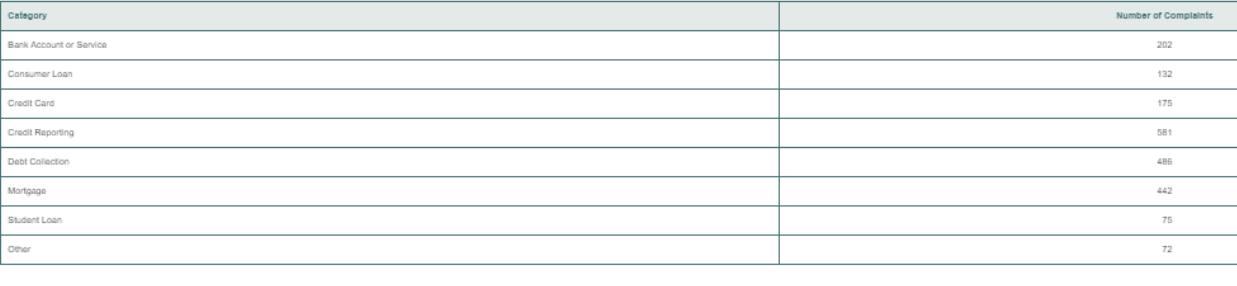
a. Construct a Pareto Chart for the categories of complaints.
b. Discuss the “vital few� and “trivial many� reasons for the categories of complaints.
The following table, stored in FinancialComplaints2, represents received from Louisiana consumers by most–complained-about company for 2016.
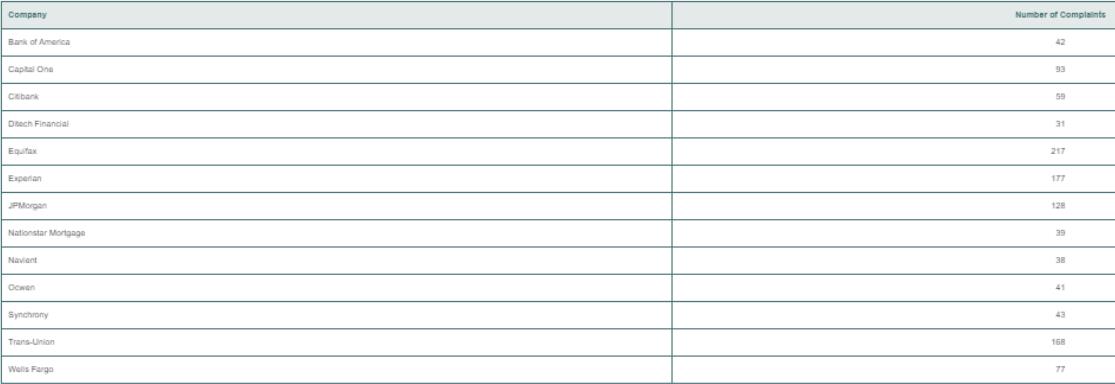
a. Construct a bar chart and a pie chart for the complaints by company.
b. What graphical method (Pareto, bat, or pie chart) do you think is best for portraying these data?
Want to see the full answer?
Check out a sample textbook solution
Chapter 2 Solutions
EBK BASIC BUSINESS STATISTICS


- the property custodian makes an inventory of the cabinets, chairs, tables, blackboards, and electric fans of each classroom. is a descriptive or inferential statistics?arrow_forwardIdentify the data collection method used in the following statements: A researcher investigates the influence of online payments on consumer spending. A local TV network asked the voters to indicate whom they voted as they exited the polling booth. The school administration asked the students whether they are willing to have an increase in laboratory fees if there is an upgrade of computers. A social welfare organization gathers information on hospital patients with mental disorders. An investigator uses information from various business reports for analysis.arrow_forwardIn 2010, the U.S. Congress passed the historic health care reform bill that will provide some type of coverage for the 32 million Americans currently without health care insurance. Just how widespread is the lack of medical coverage? The media claim that the segments of the population most at risk for disease and thus needing healthcare are women, children, the elderly and the poor. The following tables were generated from the U.S. Census Bureau, Current Population Survey, Annual Social and Economic Supplement (2011). The tables report the number of uninsured (in thousands) by sex, by age, and by household income. Is being insured or not dependent on gender? Fill in the degrees of freedom and p-value in the output below and draw a clear conclusion indicating which gender is more at risk of not being insured if there is a significant difference.arrow_forward
- In 2010, the U.S. Congress passed the historic health care reform bill that will provide some type of coverage for the 32 million Americans currently without health care insurance. Just how widespread is the lack of medical coverage? The media claim that the segments of the population most at risk for disease and thus needing healthcare are women, children, the elderly and the poor. The following tables were generated from the U.S. Census Bureau, Current Population Survey, Annual Social and Economic Supplement (2011). The tables report the number of uninsured (in thousands) by sex, by age, and by household income Is being insured or not dependent on the age groups identified in the analysis? Fill in the degrees of freedom and p-value in the output below and draw a clear conclusion indicating which age-groups are more at risk of not being insured if there is a significant relationshiparrow_forwardEach row of the accompanying data indicates the make of vehicles sold at auction in a region in 2010. The data table describes 190 vehicles. Complete parts (a) through (d). | Click the icon to view the data table. Is What's a problem with this chart? O A. The data are categorical, so the pie chart cannot be interpreted. O B. Some of the categories are too large and take up the majority of the available space. c. Some of the categories are too small to see easily. D. The data are not categorical, so the pie chart cannot be interpreted.arrow_forwardIn 2010, the U.S. Congress passed the historic health care reform bill that will provide some type of coverage for the 32 million Americans currently without health care insurance. Just how widespread is the lack of medical coverage? The media claim that the segments of the population most at risk for disease and thus needing healthcare are women, children, the elderly and the poor. The following tables were generated from the U.S. Census Bureau, Current Population Survey, Annual Social and Economic Supplement (2011). Explain using supportive arguments from your analyses. Write a general summary paragraph identifying groups lacking in coverage by gender, age and income and commenting on the headline. Reference the observed numbers and percentages in your summary paragraph to see how the groups trend in identifying potentially more at-risk. Analysises for reference: Is being insured or not dependent on gender? Fill in the degrees of freedom and p-value in the output below and draw…arrow_forward
- In 2010, the U.S. Congress passed the historic health care reform bill that will provide some type of coverage for the 32 million Americans currently without health care insurance. Just how widespread is the lack of medical coverage? The media claim that the segments of the population most at risk for disease and thus needing healthcare are women, children, the elderly and the poor. The following tables were generated from the U.S. Census Bureau, Current Population Survey, Annual Social and Economic Supplement (2011). The tables report the number of uninsured (in thousands) by sex, by age, and by household income Is being insured or not dependent on the income groups identified in the analysis? Fill in the degrees of freedom and p-value in the output below and draw a clear conclusion indicating which income-groups are more at risk of not being insured if there is a significant relationship.arrow_forwardThe accompanying table contains the number of partners in a cohort of rising accounting firms that have been tagged as "firms to watch." Complete parts (a) through (c) below. List the five-number summary. The five-number summary is ___, ___, ____, _____, ____.arrow_forwardThe results of a search to find the least expensive round-trip flights to Atlanta and Salt Lake C major U.S. cities are shown in the following table. The departure date was June 20, 2012 and was June 27, 2012. Click on the datafile logo to reference the data, DATA file Round-Trip Cost ($) Departure City Atlanta Salt Lake Cit Cincinnati New York 340.10 321.60 291.60 570.10 354.60 465.60 Chicago Dae 210/Oarrow_forward
- B please. Table includedarrow_forwardEach year Money magazine publishes a list of "Best Places to Live in the United States." These listings are based on affordability, educational performance, convenience, safety, and livability. The below table shows the median household income of Money magazine’s top city in each U.S. state for (Money magazine website). City Median Household Income Pelham, AL $ 66,772 Juneau, AK $ 84,101 Paradise Valley, AZ $ 138,192 Fayetteville, AR $ 40,835 Monterey Park, CA $ 57,419 Lone Tree, CO $ 116,761 Manchester, CT $ 64,828 Hockessin, DE $ 115,124 St. Augustine, FL $ 47,748 Vinings, GA $ 73,103 Kapaa, HI…arrow_forward
 Glencoe Algebra 1, Student Edition, 9780079039897...AlgebraISBN:9780079039897Author:CarterPublisher:McGraw Hill
 Holt Mcdougal Larson Pre-algebra: Student Edition...AlgebraISBN:9780547587776Author:HOLT MCDOUGALPublisher:HOLT MCDOUGAL