Videos
The Excel file Syringe Samples provides data for
To define the range names for each of these samples and then use the range names in formulas to find the average values of each samples.
Explanation of Solution
Given:
The Syringe samples data for the fifteen samples in the excel file is as follows:
| Sample | Sample Observations | ||||
| S1 | 4.9600 | 4.9460 | 4.9500 | 4.9560 | 4.9580 |
| S2 | 4.9580 | 4.9270 | 4.9350 | 4.9400 | 4.9500 |
| S3 | 4.9710 | 4.9290 | 4.9650 | 4.9520 | 4.9380 |
| S4 | 4.9400 | 4.9820 | 4.9700 | 4.9530 | 4.9600 |
| S5 | 4.9640 | 4.9500 | 4.9530 | 4.9620 | 4.9560 |
| S6 | 4.9690 | 4.9510 | 4.9550 | 4.9660 | 4.9540 |
| S7 | 4.9600 | 4.9440 | 4.9570 | 4.9480 | 4.9510 |
| S8 | 4.9690 | 4.9490 | 4.9630 | 4.9520 | 4.9620 |
| S9 | 4.9840 | 4.9280 | 4.9600 | 4.9430 | 4.9550 |
| S10 | 4.9700 | 4.9340 | 4.9610 | 4.9400 | 4.9650 |
| S11 | 4.9750 | 4.9590 | 4.9620 | 4.9710 | 4.9680 |
| S12 | 4.9450 | 4.9770 | 4.9500 | 4.9690 | 4.9540 |
| S13 | 4.9760 | 4.9640 | 4.9700 | 4.9680 | 4.9720 |
| S14 | 4.9700 | 4.9540 | 4.9640 | 4.9590 | 4.9680 |
| S15 | 4.9820 | 4.9620 | 4.9680 | 4.9750 | 4.9630 |
Formulas used:
Let the range names be
| S1 | S2 | S3 | S4 | S5 | S6 | S7 | S8 | S9 | S10 | S11 | S12 | S13 | S14 | S15 |
And the formulas used for the average is:
=AVERAGE(S1), =AVERAGE(S2), and so on for fifteen samples.
Calculation:
We will apply the formula of the average in each of the samples to find out the result.
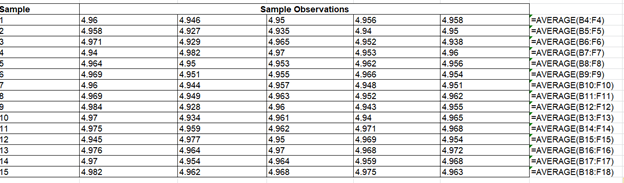
Thus, the outcome of the result is as follows:
| Sample | Sample Observations | Average | ||||
| 1 | 4.9600 | 4.9460 | 4.9500 | 4.9560 | 4.9580 | 4.9540 |
| 2 | 4.9580 | 4.9270 | 4.9350 | 4.9400 | 4.9500 | 4.9420 |
| 3 | 4.9710 | 4.9290 | 4.9650 | 4.9520 | 4.9380 | 4.9510 |
| 4 | 4.9400 | 4.9820 | 4.9700 | 4.9530 | 4.9600 | 4.9610 |
| 5 | 4.9640 | 4.9500 | 4.9530 | 4.9620 | 4.9560 | 4.9570 |
| 6 | 4.9690 | 4.9510 | 4.9550 | 4.9660 | 4.9540 | 4.9590 |
| 7 | 4.9600 | 4.9440 | 4.9570 | 4.9480 | 4.9510 | 4.9520 |
| 8 | 4.9690 | 4.9490 | 4.9630 | 4.9520 | 4.9620 | 4.9590 |
| 9 | 4.9840 | 4.9280 | 4.9600 | 4.9430 | 4.9550 | 4.9540 |
| 10 | 4.9700 | 4.9340 | 4.9610 | 4.9400 | 4.9650 | 4.9540 |
| 11 | 4.9750 | 4.9590 | 4.9620 | 4.9710 | 4.9680 | 4.9670 |
| 12 | 4.9450 | 4.9770 | 4.9500 | 4.9690 | 4.9540 | 4.9590 |
| 13 | 4.9760 | 4.9640 | 4.9700 | 4.9680 | 4.9720 | 4.9700 |
| 14 | 4.9700 | 4.9540 | 4.9640 | 4.9590 | 4.9680 | 4.9630 |
| 15 | 4.9820 | 4.9620 | 4.9680 | 4.9750 | 4.9630 | 4.9700 |
Want to see more full solutions like this?
Chapter 2 Solutions
EBK BUSINESS ANALYTICS


- Auto pistons at Wemming Chung's plant in Shanghai are produced in a forging process, and the diameter is a critical factor that must be controlled. From sample sizes of 5 pistons produced each day, the mean and the range of this diameter have been as follows: Day Mean (mm) Range R (mm) 158 4.3 151.2 4.4 155.7 4.2 153.5 4.8 156.6 4.5 What is the UCL using 3-sigma?(round your response to two decimal places). 1. 2. 4.arrow_forwardRefer to Table S6.1 - Factors for Computing Control Chart Limits (3 sigma) for this problem. Twelve samples, each containing five parts, were taken from a process that produces steel rods at Emmanual Kodzi's factory. The length of each rod in the samples was determined. The results were tabulated and sample means and ranges were computed. The results were: Sample Mean (in.) Range (in.) Sample Sample Sample Mean (in.) Range (in.) 1 9.404 0.044 7 9.403 0.021 2 9.402 0.051 8 9.405 0.058 3 9.393 0.042 9.395 0.039 4 9.404 0.037 10 9.401 0.038 9.399 0.048 11 9.401 0.054 9.397 0.053 12 9.404 0.061 For the given data, the x = inches (round your response to four decimal places). Based on the sampling done, the control limits for 3-sigma x chart are: Upper Control Limit (UCL;) = inches (round your response to four decimal places). Lower Control Limit (LCL;) = inches (round your response to four decimal places).arrow_forwardPlease do not give solution in image formate thanku. The specification for a plastic liner for concrete highway projects calls for a thickness of 6.0 mm ± 0.1 mm. The standard deviation of the process is estimated to be 0.02 mm. The process is known to operate at a mean thickness of 6.03 mm. What is the Cp and Cpk for this process? Determine whether this process meet 3-sigma requirements, 6-sigma requirements, or doesn’t meet any requirements.arrow_forward
- A component part for a motorcycle is manufactured by an investment casting process. The air vent opening on this casting is an important functional parameter of the part. The results for five samples are given in the table. The values given have been coded using the last two digits of the dimension Sample Air vent opening diameter (in mm 1 58 61 54 60 2 61 55 58 62 3 66 60 59 55 4 53 57 58 64 5 65 63 79 61 Determine the central line and control limits for the range and mean charts, and discuss whether or not the process is in statistical control.arrow_forwardBottles for room spray are supposed to weigh exactly 16 oz. Inspectors want to develop process control charts. They take five (05) boxes of four (04) bottles each and weigh them. They obtain the following data. The mean weights of each of the 05 samples are 15.2, 14.6,16.5,18.1, and 13.2 respectively. Likewise, the range values for the each of 05 samples are 0.4, 0.2, 0.4, 0.5, and 0.9 respectively. For the X-bar charts and R-charts, the Parameters, A2, D3 and D4 are respectively. Select one: a. 0.48, 0.00, 2.00 b. 0.25, 0.31, 1.69 c. 0.73, 0.00, 2.28 d. 0.37, 0.14, 1.86arrow_forwardBottles for room spray are supposed to weigh exactly 16 oz. Inspectors want to develop process control charts. They take six boxes of five bottles each and weigh them. They obtain the following data. The mean weights of each of the 6 samples are 15.43, 14.47, 18.07, 17.34 12.74and 15.58 respectively. Likewise , the range values for the each of 6 samples are 1.63.0.66 6, 0.47, 0.40, 0.20 , and 0.90 respectivelyFind out Grand Mean double bar), and mean range (R bar) aligned 16.53,0.71\\ 15.82,.0.65 aligned a. b. Oc 16.538, 0.86 e. 0.0arrow_forward
- A quality control manager in an Omani bottling company takes 5 samples for quality control purposes. These sample mean (X- bar) are; 8.51, 8.18, 11.07, 10.03, and 10.23 respectively. Additionally, the range values for these 5 samples are; 3.33, 2.61, 3.39, 4.39, and 6.49. If the lower control limit for X- bar chart is 7.664, what should be the most appropriate sample size? O a. 3 O b. None is correct O C. 4 O d. 6 O e. 5arrow_forwardA metal fabricator produces connecting rods with an outer diameter that has a 1± 0.02 inch specification. A machine operator takes several sample measurements over time and determines the sample mean outer diameter to be 1.005 inches with a standard deviation of 0.003 inch. Calculate the process capability index for this example. Note: Round your answer to 3 decimal places. Process capability indexarrow_forwardA column chart can sometimes be used instead of a line chart for time series data. Select one: True Falsearrow_forward
- A quality control manager in an Omani bottling company takes 5 samples for quality control purposes. These sample mean (X-bar) are; 8.51,8.18, 11.07, 10.03, and 10.23 respectively. Additionally, the range values for these 5 samples are; 3.33, 2.61, 3.39,4.39, and 6.49. If the lower control limit for X-bar chart is 6.65, what should be the most appropriate sample size? O a. 3 O b. 5 O c. Od. None is correct O e. 4arrow_forwardWhich of the following graphical presentations is not appropriate for numerical data? histogram pie chart time-series plot scatter plotarrow_forwardSample size (n) is 16, mean of the sample means ( ) is 15, mean of the sample ranges ( ) is 6, and population standard deviation ( ) is not known. Calculate the UCL and LCL of the mean chart (x-Chart) for this process. Group of answer choices Cannot be calculated UCL=33.0, LCL=-3.0 UCL=13.73, LCL=16.27 UCL=16.27, LCL=13.73 UCL=33.0, LCL=0arrow_forward
 BUSN 11 Introduction to Business Student EditionBusinessISBN:9781337407137Author:KellyPublisher:Cengage Learning
 Essentials of Business Communication (MindTap Cou...BusinessISBN:9781337386494Author:Mary Ellen Guffey, Dana LoewyPublisher:Cengage Learning
 Accounting Information Systems (14th Edition)BusinessISBN:9780134474021Author:Marshall B. Romney, Paul J. SteinbartPublisher:PEARSON
 International Business: Competing in the Global M...BusinessISBN:9781259929441Author:Charles W. L. Hill Dr, G. Tomas M. HultPublisher:McGraw-Hill Education