
FINANCIAL ACCT(HARDBK)+MYACCTGLAB>ICB<
W20 Edition
ISBN: 9780136615583
Author: REIMERS
Publisher: PEARSON C
expand_more
expand_more
format_list_bulleted
Videos
Textbook Question
Chapter 2, Problem 36EB
Expert Solution & Answer
Want to see the full answer?
Check out a sample textbook solution
Students have asked these similar questions
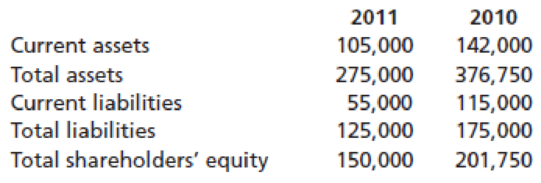
Calculate the Current Ratio, Debt Ratio, Return on Assets (ROA) and Return on Equity (ROE). For the ROA and ROE, you should use the average total assets and the average total equity in your calculations. (The average is the total across two years divided by two). Calculate these values for each of 2011-2014. Interpret your calculations: what does this information mean? How is the company doing?
These are the current ratios for Cisco Inc. for the 2018 and 2017 years.
Based on these numbers, how well or poorly is the company doing?
The financial statements for Tyler Toys, Inc. are shown in the popup window:
LOADING...
.
Calculate the debt ratio, times interest earned ratio, and cash coverage ratio for 2013 and 2014 for Tyler Toys. Should any of these ratios or the change in a ratio warrant concern for the managers of Tyler Toys or the shareholders?
Tyler Toys, Inc.
Income Statement for Years Ending December 31, 2013 and 2014
2014
2013
Revenue
$14,146,575
$13,566,748
Cost of goods sold
$-8,448,000
$-8,132,335
Selling, general, andadministrative expenses
$-998,406
$-980,458
Depreciation
$-1,497,529
$-1,471,013
EBIT
$3,202,640
$2,982,942
Interest expense
$-376,217
$-354,594
Taxes
$-1,074,041
$-998,772
Net income
$1,752,382
$1,629,576
Right-click on the table and select Copy to Clipboard and then right-click the
highlighted texts in the popup dialogue box and select Copy in order to paste its…
Chapter 2 Solutions
FINANCIAL ACCT(HARDBK)+MYACCTGLAB>ICB<
Ch. 2 - Prob. 1YTCh. 2 - Prob. 2YTCh. 2 - Is prepaid insurance an expense or an asset?...Ch. 2 - Prob. 4YTCh. 2 - Give an example of the matching principle from the...Ch. 2 - What is the difference between cash basis and...Ch. 2 - Prob. 7YTCh. 2 - What is GAAP? What is IFRS?Ch. 2 - Prob. 2QCh. 2 - Prob. 3Q
Ch. 2 - Prob. 4QCh. 2 - Prob. 5QCh. 2 - What are the four basic financial statements?Ch. 2 - Which financial statement pertains to a single...Ch. 2 - Prob. 8QCh. 2 - Prob. 9QCh. 2 - Prob. 10QCh. 2 - Prob. 11QCh. 2 - Prob. 12QCh. 2 - What does recognize revenue mean in accounting?Ch. 2 - Prob. 14QCh. 2 - What is an accrual? What is a deferral?Ch. 2 - Must a company collect the money from a sale...Ch. 2 - What is the cost of goods sold?Ch. 2 - Explain the difference between cash basis...Ch. 2 - Prob. 19QCh. 2 - Prob. 20QCh. 2 - Prob. 21QCh. 2 - Prob. 1MCQCh. 2 - Prob. 2MCQCh. 2 - Prob. 3MCQCh. 2 - Prob. 4MCQCh. 2 - Prob. 5MCQCh. 2 - Prob. 6MCQCh. 2 - Prob. 7MCQCh. 2 - Prob. 8MCQCh. 2 - Prob. 9MCQCh. 2 - Prob. 10MCQCh. 2 - Elements of the financial statements. (LO 3). For...Ch. 2 - Prob. 2SEACh. 2 - Prob. 3SEACh. 2 - Prob. 4SEACh. 2 - Prob. 5SEACh. 2 - Prob. 6SEACh. 2 - Cash versus credit sales. (LO 3, 4). Company A had...Ch. 2 - Prob. 8SEACh. 2 - Prob. 9SEACh. 2 - Prob. 10SEACh. 2 - Prob. 11SEBCh. 2 - Prob. 12SEBCh. 2 - Prob. 13SEBCh. 2 - Prob. 14SEBCh. 2 - Prob. 15SEBCh. 2 - Prob. 16SEBCh. 2 - Prob. 17SEBCh. 2 - Prob. 18SEBCh. 2 - Prob. 19SEBCh. 2 - Prob. 20SEBCh. 2 - Prob. 21EACh. 2 - Prob. 22EACh. 2 - Prob. 23EACh. 2 - Balance sheet and income statement transactions....Ch. 2 - Prob. 25EACh. 2 - Prob. 26EACh. 2 - Prob. 27EACh. 2 - Prob. 28EACh. 2 - Elements of the financial statements. (LO 3). The...Ch. 2 - Prob. 30EBCh. 2 - Elements of the financial statements. (LO 3)....Ch. 2 - Prob. 32EBCh. 2 - Prob. 33EBCh. 2 - Prob. 34EBCh. 2 - Prob. 35EBCh. 2 - Current ratio. (LO 5). The following data was...Ch. 2 - Prob. 37PACh. 2 - Prob. 38PACh. 2 - Prob. 39PACh. 2 - Prob. 40PACh. 2 - Prob. 41PACh. 2 - Prob. 42PBCh. 2 - Prob. 43PBCh. 2 - Prob. 44PBCh. 2 - Prob. 45PBCh. 2 - Prob. 46PBCh. 2 - Prob. 1FSACh. 2 - Prob. 2FSACh. 2 - Prob. 3FSA
Knowledge Booster


Learn more about
Need a deep-dive on the concept behind this application? Look no further. Learn more about this topic, accounting and related others by exploring similar questions and additional content below.Similar questions
- Lowes Companies Inc., a major competitor of The Home Depot in the home improvement business, operates over 1,700 stores. Lowes recently reported the following balance sheet data (in millions): a. Determine the total stockholders equity at the end of Years 2 and 1. b. Determine the ratio of liabilities to stockholders equity for Year 2 and Year 1. Round to two decimal places. c. What conclusions regarding the risk to the creditors can you draw from (b)? d. Using the balance sheet data for The Home Depot in Exercise 1-26, how does the ratio of liabilities to stockholders equity of Lowes compare to that of The Home Depot?arrow_forwardPlease select THREE of the ratios listed below and perform them for years 2012 and 2011. Please interpret the data by including the following: (1) Write out the formula for each ratio you selected and show your calculations. (2) Discuss whether each ratio you selected measures liquidity or profitability and what those terms mean. (3) What factor(s) contributed to the increase or decrease from last year? Discuss whether those changes were favorable or unfavorable to the company and why? (4) What does each of your calculated ratios potentially mean for the company’s overall financial condition? Please assume the market price of the common stock on 12/31/11 was $113.40. Also, if you need any numbers from 2010 for averages, please use the following: Cash 300,000 Marketable securities 1,000,000 A/R 345,000 Inventory 647,000 Prepaids 220,000…arrow_forwardAt the end of a recent year, the gap inc. reported total assets of 7,422 million, current assets as 4,309 million, total liabilities of 4,667, current liabilities of 2,128 million, and stockholder's equity of 2,775 million. What is the current ratio and what does this suggest about the company? a. The ratio of 1.59 suggests that the Gap has liquidity problemsb. The ratio of 2.02 suggests that The Gap has sufficient liquidityc. The ratio of 1.59 suggests that The Gap has greater current assets than current liabilitiesd. The ratio of 2.02 suggests that The Gap is not able to pay its short-term obligations with current assetsarrow_forward
- Compute the following ratios for the most recent two years, show all values in the computations: 1.Current ratio 2.Accounts receivable turnover 3.Debt ratio(TotalLiabilities/Total Assets, as a percentage) 4.Debt-to-equity ratio Based on the results above, what conclusions can you make about the liquidity and solvency of the company?arrow_forwardThese are the current ratios for Facebook INC. for the 2018 and 2017 years. Based on these numbers, how well or poorly is the company doing?arrow_forward3 Suppose these selected condensed data are taken from recent balance sheets of Tyson Farms (in thousands). Compute the current ratio for each year and comment on your results. 2018 2017 Cash $13,606 $7,669 Accounts receivable 23,045 19,951 Inventory 31,087 31,345 Other current assets 12,522 11,909 Total current assets $80,000 $70,874 Total current liabilities $245,805 $326,203 Current ratio:arrow_forward
- Refer to the above company’s financial statements. Calculate the current and quick ratios. Has the company’s liquidity position improved or worsened? Explain. A computer manufacturer has financial statements as follows: Income Statements for Year Ending December 31 (Thousands of Dollars) 2019 2018 Sales $945,000 $900,000 Expenses excluding depreciation and amortization 812,700 774,000 EBITDA $132,300 $126,000 Depreciation and amortization 33,100 31,500 EBIT $99,200 $94,500 Interest Expense 10,470 8,600 EBT $88,730 $85,900 Taxes (25%) 22,183 21,475 Net income $66,547 $64,425 Common dividends $56,609 $54,115 Addition to retained earnings $9,938 $10,310 Balance Sheets for Year Ending December 31 (Thousands of Dollars) Assets 2019 2018 Cash and cash equivalents…arrow_forwardThe 2008 balance sheet of Maria's Tennis Shop, Inc., showed long-term debt of $2.35 million, and the 2009 balance sheet showed long-term debt of $4.3 million. The 2009 income statement showed an interest expense of $180,000. What was the firm's cash flow to creditors during 2009?arrow_forwardPare Plumbing Products Ltd. reported the following data in 2018 (in millions): Data table 2018 Net operating revenues. . . . . . . . $32.7 Operating expenses. . . . . . . . . . 28.2 Operating income. . . . . . . . . . . . 4.5 Nonoperating items: Interest expense. . . . . . . . (1.1) Other. . . . . . . . . . . . . . . . . (0.1) Net income. . . . . . . . . . . . . . . . . . $3.3 Total assets. . . . . . . . . . . . . . . . . $200.0 Total stockholders' equity. . . . . . 74.0 Compute Pare's leverage ratio, debt ratio, and times-interest-earned ratio, and write a sentence to explain what those ratio values mean. Use year-end figures in place of averages where needed for the purpose of calculating the ratios. Would you be willing to lend Pare $1 million? Why or why not? (Enter all amounts in millions.) First, compute Pare's leverage…arrow_forward
- Compute each of the following ratios for Jarir, Inc. and Extra Inc. as of January 31, 2009, using the amounts originally reported in their balance sheets for the year.(1) Liabilities to Assets Ratio = Total Liabilities/Total Assets(2) Long-Term Debt to Long-Term Capital Ratio = Long-Term Debt/(Long-Term Debt +Shareholders’ Equity)arrow_forwardThe financial statements for Tyler Toys, Inc. are shown in the popup window: LOADING... . Calculate the profit margin, return on assets, and return on equity for 2013 and 2014 for Tyler Toys. Should any of these ratios or the change in a ratio warrant concern for the managers of Tyler Toys or the shareholders? Tyler Toys, Inc. Income Statement for Years Ending December 31, 2013 and 2014 2014 2013 Revenue $14,146,094 $13,567,551 Cost of goods sold $-8,448,688 $-8,131,338 Selling, general, and administrative expenses $-998,878 $-980,620 Depreciation $-1,497,580 $-1,472,740 EBIT $3,200,948 $2,982,853 Interest expense $-376,634 $-354,060 Taxes $-1,073,239 $-998,941 Net income $1,751,075 $1,629,852 Right-click on the table and select Copy to Clipboard and then right-click the highlighted texts in the popup dialogue box and select Copy in order to paste its…arrow_forwarda. what are the debt to equity ratios at the beginning and the end of the 2018 fiscal business year? Has the ratio improved? If so, by how much? b. the restaurant has last cash at the end of the year than it had at the beginning, is that a bad thing? explain.arrow_forward
arrow_back_ios
SEE MORE QUESTIONS
arrow_forward_ios
Recommended textbooks for you
 Financial Accounting: The Impact on Decision Make...AccountingISBN:9781305654174Author:Gary A. Porter, Curtis L. NortonPublisher:Cengage Learning
 Financial AccountingAccountingISBN:9781337272124Author:Carl Warren, James M. Reeve, Jonathan DuchacPublisher:Cengage Learning
 Financial AccountingAccountingISBN:9781305088436Author:Carl Warren, Jim Reeve, Jonathan DuchacPublisher:Cengage Learning
Financial Accounting: The Impact on Decision Make...
Accounting
ISBN:9781305654174
Author:Gary A. Porter, Curtis L. Norton
Publisher:Cengage Learning
Financial Accounting
Accounting
ISBN:9781337272124
Author:Carl Warren, James M. Reeve, Jonathan Duchac
Publisher:Cengage Learning
Financial Accounting
Accounting
ISBN:9781305088436
Author:Carl Warren, Jim Reeve, Jonathan Duchac
Publisher:Cengage Learning
IAS 10 Events After the Reporting Period; Author: Silvia of CPDbox;https://www.youtube.com/watch?v=ijYZlb1_ZyQ;License: Standard Youtube License