
EBK STATISTICAL TECHNIQUES IN BUSINESS
17th Edition
ISBN: 9781259924163
Author: Lind
Publisher: MCGRAW HILL BOOK COMPANY
expand_more
expand_more
format_list_bulleted
Videos
Textbook Question
Chapter 2, Problem 37CE
A chain of sport shops catering to beginning skiers, headquartered in Aspen, Colorado, plans to conduct a study of how much a beginning skier spends on his or her initial purchase of equipment and supplies. Based on these figures, it wants to explore the possibility of offering combinations, such as a pair of boots and a pair of skis, to induce customers to buy more. A sample of 44 cash register receipts revealed these initial purchases:
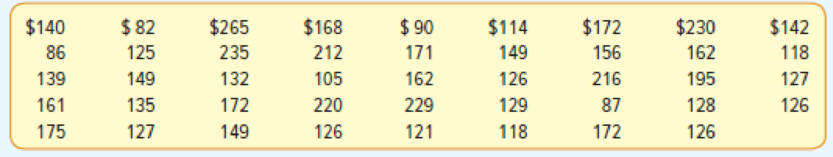
- a. Arrive at a suggested class interval.
- b. Organize the data into a frequency distribution using a lower limit of $70.
- c. Interpret your findings.
Expert Solution & Answer
Want to see the full answer?
Check out a sample textbook solution
Students have asked these similar questions
A chain of sport shops catering to beginning skiers, headquartered in Aspen, Colorado, plans to conduct a study of how much a beginning skier spends on his or her initial purchase of equipment and supplies. Based on these figures, it wants to explore the possibility of offering combinations, such as a pair of boots and a pair of skis, to induce customers to buy more. A sample of 44 cash register receipts revealed these initial purchases:
$ 140
$ 83
$ 139
$ 161
$ 175
$ 83
$ 129
$ 149
$ 141
130
264
231
132
172
149
170
214
105
220
126
90
171
162
229
121
117
149
126
130
118
172
156
214
87
172
230
162
195
128
126
142
118
127
130
1. a)Find the smallest class interval. Use five classes. (Round your answer to 1 decimal place.)
b) What would be a better class interval?
c)
The following table represents gas well completions during 1986 in North and South America. Source: American Gas Association, 1987 Gas Facts, p. 50.
D
D’
Dry
Not Dry
N
North America
14,131
31,575
45,706
N’
South America
404
2,563
2,967
14,535
34,138
48,673
P (D or N)=?
P(D’ or N’)=?
P(D or N’)=?
P(D’ or N)=?
Amie Jackson, a manager at Sigma travel services, makes every effort to ensure that customers attempting to make online reservations do not have to wait too long to complete the reservation process. The travel website is open for reservations 24 hours a day, and Amie regularly checks the website for the waiting time to maintain consistency in service. She uses the following independently drawn samples of wait time during two peak hours, morning 8 a.m. to 10 a.m. and evening 7 p.m. to 9 p.m., for the analysis. Assume that wait times are normally distributed. Wait Time (in seconds) Morning hours 8 a.m. to 10 a.m. 97 101 115 107 129 98 96 132 118 104 123 128 95 127 112 Evening hours 7 p.m. to 9 p.m. 95 92 89 90 102 96 85 81 84 100 97 80 98 79 99 At the 10% significance level, which of the following is the correct conclusion?
Do not reject H0. We conclude that the variance of wait time during morning peak hours differs from that during the evening peak hours.
Reject H0. We…
Chapter 2 Solutions
EBK STATISTICAL TECHNIQUES IN BUSINESS
Ch. 2 - DeCenzo Specialty Food and Beverage Company has...Ch. 2 - A pie chart shows the relative market share of...Ch. 2 - In a marketing study, 100 consumers were asked to...Ch. 2 - A total of 1,000 residents in Minnesota were asked...Ch. 2 - Two thousand frequent business travelers are asked...Ch. 2 - Wellstone Inc. produces and markets replacement...Ch. 2 - A small business consultant is investigating the...Ch. 2 - In the first quarter of last year, the 11 members...Ch. 2 - Prob. 3SRCh. 2 - A set of data consists of 38 observations. How...
Ch. 2 - A set of data consists of 45 observations between...Ch. 2 - A set of data consists of 230 observations between...Ch. 2 - A set of data contains 53 observations. The...Ch. 2 - Wachesaw Manufacturing Inc. produced the following...Ch. 2 - The Quick Change Oil Company has a number of...Ch. 2 - The manager of the BiLo Supermarket in Mt....Ch. 2 - The food services division of Cedar River...Ch. 2 - The annual imports of a selected group of...Ch. 2 - Mollys Candle Shop has several retail stores in...Ch. 2 - The following chart shows the number of patients...Ch. 2 - The following frequency distribution reports the...Ch. 2 - Prob. 18ECh. 2 - A sample of the hourly wages of 15 employees at...Ch. 2 - The following cumulative frequency and the...Ch. 2 - The cumulative frequency and the cumulative...Ch. 2 - The frequency distribution representing the number...Ch. 2 - Prob. 22ECh. 2 - Describe the similarities and differences of...Ch. 2 - Describe the similarities and differences between...Ch. 2 - Alexandra Damonte will be building a new resort in...Ch. 2 - Prob. 26CECh. 2 - A data set consists of 83 observations. How many...Ch. 2 - A data set consists of 145 observations that range...Ch. 2 - The following is the number of minutes to commute...Ch. 2 - The following data give the weekly amounts spent...Ch. 2 - A social scientist is studying the use of iPods by...Ch. 2 - David Wise handles his own investment portfolio,...Ch. 2 - You are exploring the music in your iTunes...Ch. 2 - The monthly issues of the Journal of Finance are...Ch. 2 - The following histogram shows the scores on the...Ch. 2 - The following chart summarizes the selling price...Ch. 2 - A chain of sport shops catering to beginning...Ch. 2 - The numbers of outstanding shares for 24 publicly...Ch. 2 - A recent survey showed that the typical American...Ch. 2 - Midland National Bank selected a sample of 40...Ch. 2 - Residents of the state of South Carolina earned a...Ch. 2 - A recent study of home technologies reported the...Ch. 2 - Merrill Lynch recently completed a study regarding...Ch. 2 - A total of 5.9% of the prime-time viewing audience...Ch. 2 - Refer to the following chart: a. What is the name...Ch. 2 - The following chart depicts the annual revenues,...Ch. 2 - Prob. 47CECh. 2 - Prob. 48CECh. 2 - One of the most popular candies in the United...Ch. 2 - The number of families who used the Minneapolis...Ch. 2 - Refer to the North Valley Real Estate data that...Ch. 2 - Prob. 52DACh. 2 - Refer to the Lincolnville School District bus...
Knowledge Booster


Learn more about
Need a deep-dive on the concept behind this application? Look no further. Learn more about this topic, statistics and related others by exploring similar questions and additional content below.Similar questions
- Amie Jackson, a manager at Sigma travel services, makes every effort to ensure that customers attempting to make online reservations do not have to wait too long to complete the reservation process. The travel website is open for reservations 24 hours a day, and Amie regularly checks the website for the waiting time to maintain consistency in service. She uses the following independently drawn samples of wait time during two peak hours, morning 8 a.m. to 10 a.m. and evening 7 p.m. to 9 p.m., for the analysis. Assume that wait times are normally distributed. Wait Time (in seconds) Morning hours 8 a.m. to 10 a.m. 97 101 115 107 129 98 96 132 118 104 123 128 95 127 112 Evening hours 7 p.m. to 9 p.m. 95 92 89 90 102 96 85 81 84 100 97 80 98 79 99 A 90% confidence interval is found to be [1.19, 7.36], where the morning is the first group and the evening is the second group. Which of the following is the correct conclusion? Multiple Choice We can conclude the…arrow_forwardIn the following, define in words the population parameter p. Twenty students are randomly selected from the list of all sorority and fraternity members at a university, to determine if a majority of sorority and fraternity students favor a new policy on alcohol on campus. The hypotheses are as follows: H0: p = .50Ha: p > .50 a) The proportion of fraternity members favoring a new alcohol policy on campus. b)The proportion of sorority students favoring a new alcohol policy on campus. c) The proportion of one student favoring a new alcohol policy on campus. d) The proportion of all students favoring a new alcohol policy on campusarrow_forwardThe 2006 Statistical Abstract of the United States reports on a survey that asked a national sample of 80,000 American households about pet ownership. Suppose (for now) that one-third of all American households own a pet cat. Still supposing that one-third of all American households own a pet cat, between what two values do you expect 95% of all sample proportions to fall?arrow_forward
arrow_back_ios
arrow_forward_ios
Recommended textbooks for you
 Holt Mcdougal Larson Pre-algebra: Student Edition...AlgebraISBN:9780547587776Author:HOLT MCDOUGALPublisher:HOLT MCDOUGAL
Holt Mcdougal Larson Pre-algebra: Student Edition...
Algebra
ISBN:9780547587776
Author:HOLT MCDOUGAL
Publisher:HOLT MCDOUGAL
Hypothesis Testing using Confidence Interval Approach; Author: BUM2413 Applied Statistics UMP;https://www.youtube.com/watch?v=Hq1l3e9pLyY;License: Standard YouTube License, CC-BY
Hypothesis Testing - Difference of Two Means - Student's -Distribution & Normal Distribution; Author: The Organic Chemistry Tutor;https://www.youtube.com/watch?v=UcZwyzwWU7o;License: Standard Youtube License