EBK STATISTICAL TECHNIQUES IN BUSINESS
17th Edition
ISBN: 9781259924163
Author: Lind
Publisher: MCGRAW HILL BOOK COMPANY
bartleby

Concept explainers

bartleby

Videos

Textbook Question
Book Icon
Chapter 2, Problem 1SR

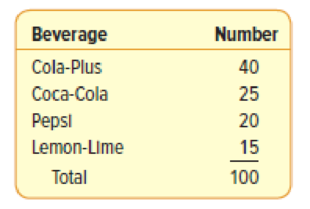
DeCenzo Specialty Food and Beverage Company has been serving a cola drink with an additional flavoring, Cola-Plus, that is very popular among its customers. The company is interested in customer preferences for Cola-Plus versus Coca-Cola. Pepsi, and a lemon-lime beverage. They ask 100 randomly sampled customers to take a taste test and select the beverage they prefer most. The results are shown in the following table:

Chapter 2, Problem 1SR, DeCenzo Specialty Food and Beverage Company has been serving a cola drink with an additional

  1. (a) Is the data qualitative or quantitative? Why?
  2. (b) What is the table called? What does it show?
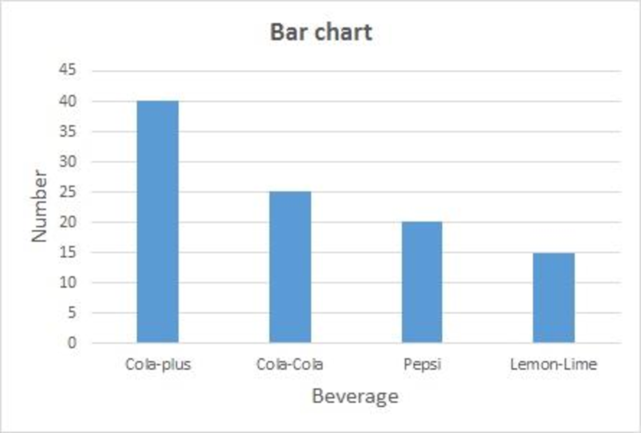
  3. (c) Develop a bar chart to depict the information.
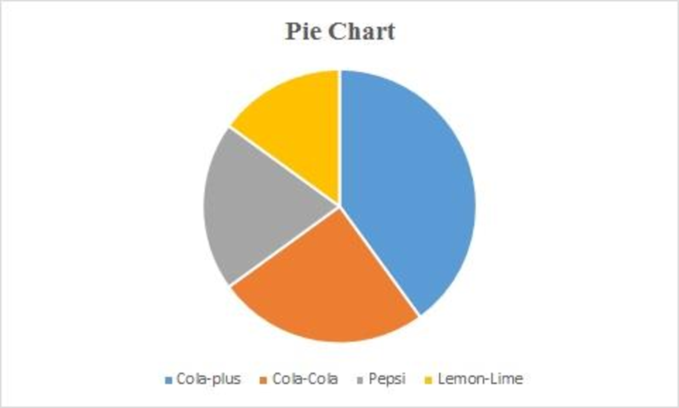
  4. (d) Develop a pie chart using the relative frequencies.

a.

Expert Solution
Check Mark
To determine

Identify the nature of the data whether it is qualitative or quantitate.

Explain your answer.

Answer to Problem 1SR

The nature of the data is quantitative.

Explanation of Solution

The given table explains the frequencies of different cola drinks with additional flavors that people prefer the most. The number of people who liked each flavor of cola drink is represented as numerical values. Therefore, the nature of the data is quantitative.

b.

Expert Solution
Check Mark
To determine

Identify the name of the table.

Explain what does the table represents.

Answer to Problem 1SR

The given table is called as the frequency table.

The table explains the frequencies of different cola drinks with additional flavors that people prefer the most.

Explanation of Solution

Frequency table:

The frequency table is a collection of mutually exclusive and exhaustive classes that show the number of observations in each class.

Here, the given table explains the frequencies of different cola drinks with additional flavors that people prefer the most. Therefore, the given table is called as the frequency table.

c.

Expert Solution
Check Mark
To determine

Construct a bar chart to depict the given information.

Answer to Problem 1SR

The bar chart for the given data is represented as follows:

EBK STATISTICAL TECHNIQUES IN BUSINESS, Chapter 2, Problem 1SR , additional homework tip  1

Explanation of Solution

The bar chart for the given data can be drawn using EXCEL.

Step-by-step procedure to obtain bar chart using EXCEL is given below:

  • Select the total data range with labels.
  • Go to Insert > Charts > Bar chart.
  • Select the appropriate bar chart.
  • Click OK.

d.

Expert Solution
Check Mark
To determine

Construct a pie chart using the relative frequencies.

Answer to Problem 1SR

The pie chart for the given data is represented as follows:

EBK STATISTICAL TECHNIQUES IN BUSINESS, Chapter 2, Problem 1SR , additional homework tip  2

Explanation of Solution

The pie chart for the given data can be drawn using EXCEL.

Step-by-step procedure to obtain pie chart using EXCEL is given below:

  • Select the total data range with labels.
  • Go to Insert > Charts > pie chart.
  • Select the appropriate pie chart.
  • Click OK.

Want to see more full solutions like this?

Subscribe now to access step-by-step solutions to millions of textbook problems written by subject matter experts!

Chapter 2 Solutions

EBK STATISTICAL TECHNIQUES IN BUSINESS

Ch. 2 - A set of data consists of 45 observations between...Ch. 2 - A set of data consists of 230 observations between...Ch. 2 - A set of data contains 53 observations. The...Ch. 2 - Wachesaw Manufacturing Inc. produced the following...Ch. 2 - The Quick Change Oil Company has a number of...Ch. 2 - The manager of the BiLo Supermarket in Mt....Ch. 2 - The food services division of Cedar River...Ch. 2 - The annual imports of a selected group of...Ch. 2 - Mollys Candle Shop has several retail stores in...Ch. 2 - The following chart shows the number of patients...Ch. 2 - The following frequency distribution reports the...Ch. 2 - Prob. 18ECh. 2 - A sample of the hourly wages of 15 employees at...Ch. 2 - The following cumulative frequency and the...Ch. 2 - The cumulative frequency and the cumulative...Ch. 2 - The frequency distribution representing the number...Ch. 2 - Prob. 22ECh. 2 - Describe the similarities and differences of...Ch. 2 - Describe the similarities and differences between...Ch. 2 - Alexandra Damonte will be building a new resort in...Ch. 2 - Prob. 26CECh. 2 - A data set consists of 83 observations. How many...Ch. 2 - A data set consists of 145 observations that range...Ch. 2 - The following is the number of minutes to commute...Ch. 2 - The following data give the weekly amounts spent...Ch. 2 - A social scientist is studying the use of iPods by...Ch. 2 - David Wise handles his own investment portfolio,...Ch. 2 - You are exploring the music in your iTunes...Ch. 2 - The monthly issues of the Journal of Finance are...Ch. 2 - The following histogram shows the scores on the...Ch. 2 - The following chart summarizes the selling price...Ch. 2 - A chain of sport shops catering to beginning...Ch. 2 - The numbers of outstanding shares for 24 publicly...Ch. 2 - A recent survey showed that the typical American...Ch. 2 - Midland National Bank selected a sample of 40...Ch. 2 - Residents of the state of South Carolina earned a...Ch. 2 - A recent study of home technologies reported the...Ch. 2 - Merrill Lynch recently completed a study regarding...Ch. 2 - A total of 5.9% of the prime-time viewing audience...Ch. 2 - Refer to the following chart: a. What is the name...Ch. 2 - The following chart depicts the annual revenues,...Ch. 2 - Prob. 47CECh. 2 - Prob. 48CECh. 2 - One of the most popular candies in the United...Ch. 2 - The number of families who used the Minneapolis...Ch. 2 - Refer to the North Valley Real Estate data that...Ch. 2 - Prob. 52DACh. 2 - Refer to the Lincolnville School District bus...
Knowledge Booster
Background pattern image
Statistics
Learn more about
Need a deep-dive on the concept behind this application? Look no further. Learn more about this topic, statistics and related others by exploring similar questions and additional content below.
Recommended textbooks for you
Text book image
Glencoe Algebra 1, Student Edition, 9780079039897...
Algebra
ISBN:9780079039897
Author:Carter
Publisher:McGraw Hill
Text book image
Big Ideas Math A Bridge To Success Algebra 1: Stu...
Algebra
ISBN:9781680331141
Author:HOUGHTON MIFFLIN HARCOURT
Publisher:Houghton Mifflin Harcourt
Text book image
Holt Mcdougal Larson Pre-algebra: Student Edition...
Algebra
ISBN:9780547587776
Author:HOLT MCDOUGAL
Publisher:HOLT MCDOUGAL
Text book image
College Algebra (MindTap Course List)
Algebra
ISBN:9781305652231
Author:R. David Gustafson, Jeff Hughes
Publisher:Cengage Learning
The Shape of Data: Distributions: Crash Course Statistics #7; Author: CrashCourse;https://www.youtube.com/watch?v=bPFNxD3Yg6U;License: Standard YouTube License, CC-BY
Shape, Center, and Spread - Module 20.2 (Part 1); Author: Mrmathblog;https://www.youtube.com/watch?v=COaid7O_Gag;License: Standard YouTube License, CC-BY
Shape, Center and Spread; Author: Emily Murdock;https://www.youtube.com/watch?v=_YyW0DSCzpM;License: Standard Youtube License