
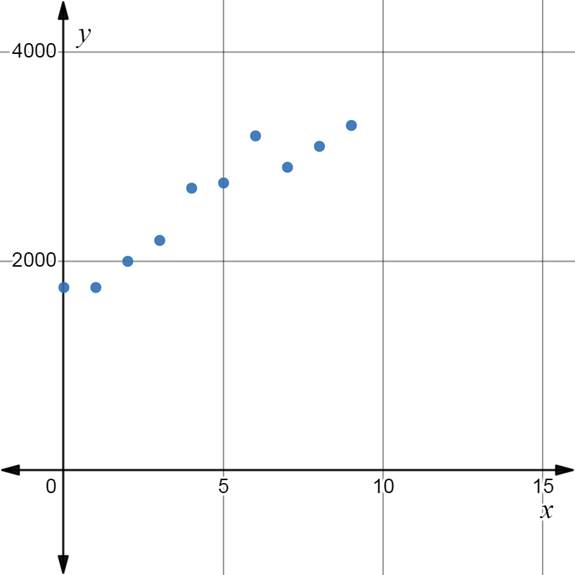
a.
To make:Thescatter plot of set of data.
Given information:
Calculation:
Let the year 2000 represents be
The new table of the data,
Plot the points on graph and draw
b.
To find:The equation of trend line.
Given information:
Calculation:
Choose two points on graph from part(a) and draw trend line.
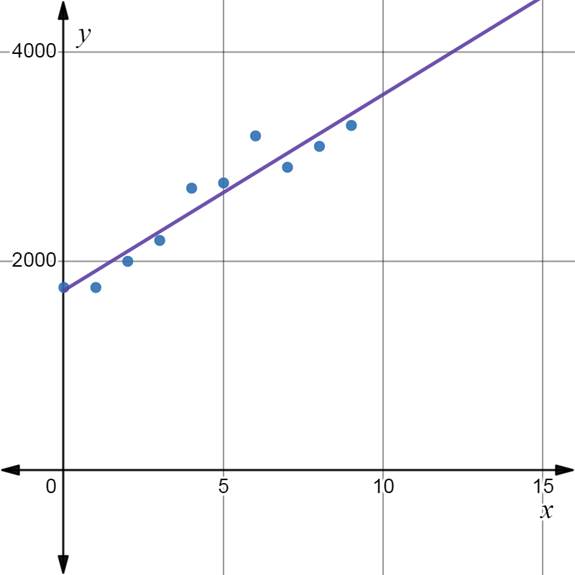
The equation of the trend line,
c.
To find:The equation of trend line.
Given information:
Calculation:
Put
Thus, the amount spend on vacation will be about
d.
To explain:How to use trend line to estimate the spend amount.
Given information:
Calculation:
Put
Trend line will give estimated value of the specific year. Because this is scatter plot the data. It might be above or below the calculated value but near by
A trendline is most often used to display data of two different quantity.A trendline is a
great tool for predicting what value will have in the future.
In this question predict the amount of spend on vacation in the year 2015. Using trend line calculated the future value.
Chapter 2 Solutions
High School Math 2015 Common Core Algebra 2 Student Edition Grades 10/11

 Algebra and Trigonometry (6th Edition)AlgebraISBN:9780134463216Author:Robert F. BlitzerPublisher:PEARSON
 Contemporary Abstract AlgebraAlgebraISBN:9781305657960Author:Joseph GallianPublisher:Cengage Learning
 Linear Algebra: A Modern IntroductionAlgebraISBN:9781285463247Author:David PoolePublisher:Cengage Learning
 Algebra And Trigonometry (11th Edition)AlgebraISBN:9780135163078Author:Michael SullivanPublisher:PEARSON
 Introduction to Linear Algebra, Fifth EditionAlgebraISBN:9780980232776Author:Gilbert StrangPublisher:Wellesley-Cambridge Press
 College Algebra (Collegiate Math)AlgebraISBN:9780077836344Author:Julie Miller, Donna GerkenPublisher:McGraw-Hill Education