
To find:The scatter plot and a linear model of the production and export of rice from 1985 to 2005.
Given information:
The data set table of rice production and export,
Calculation:
Let be
It means export is independent and production is dependent.
Now plot the
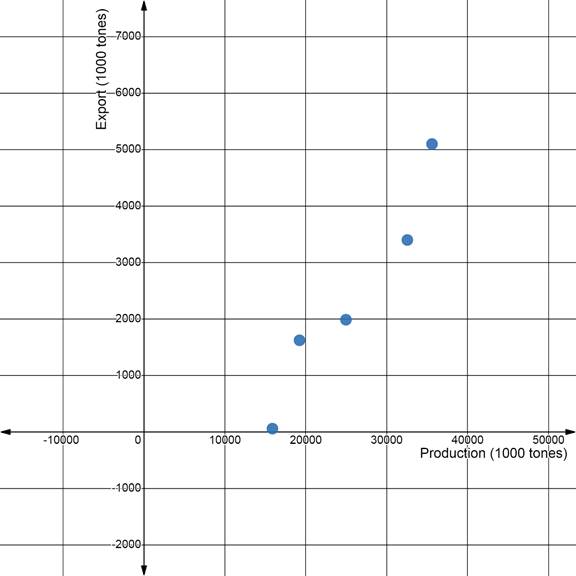
Now add trend lines by using two points from the graph such that the line is best fitted the data.
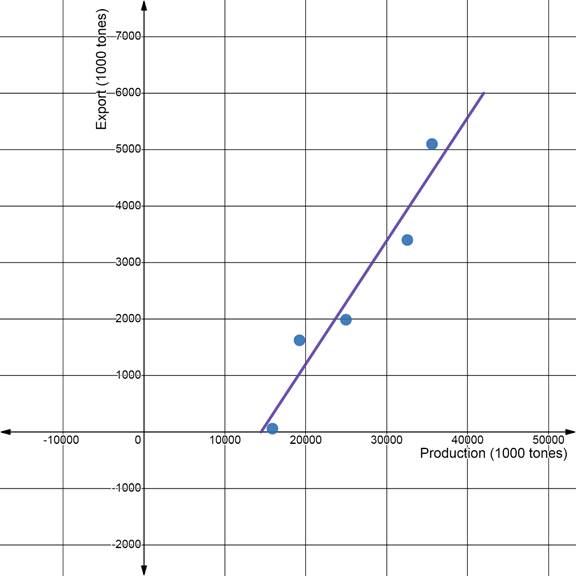
The linear model of the data set,
In year 2015 the production is 42,250,000 tones. As
Put
The estimate export of rice in 2015 is
Use model to find the estimate export for the production of specific year.
A trend line is used to express a relationship in a scatter plot of different data points of two data compare. It is can be used as a prediction tool for export.
Chapter 2 Solutions
High School Math 2015 Common Core Algebra 2 Student Edition Grades 10/11

 Algebra and Trigonometry (6th Edition)AlgebraISBN:9780134463216Author:Robert F. BlitzerPublisher:PEARSON
 Contemporary Abstract AlgebraAlgebraISBN:9781305657960Author:Joseph GallianPublisher:Cengage Learning
 Linear Algebra: A Modern IntroductionAlgebraISBN:9781285463247Author:David PoolePublisher:Cengage Learning
 Algebra And Trigonometry (11th Edition)AlgebraISBN:9780135163078Author:Michael SullivanPublisher:PEARSON
 Introduction to Linear Algebra, Fifth EditionAlgebraISBN:9780980232776Author:Gilbert StrangPublisher:Wellesley-Cambridge Press
 College Algebra (Collegiate Math)AlgebraISBN:9780077836344Author:Julie Miller, Donna GerkenPublisher:McGraw-Hill Education