
Concept explainers
Videos
The numbers of outstanding shares for 24 publicly traded companies are listed in the following table.
- a. Using the number of outstanding shares, summarize the companies with a frequency distribution.
- b. Display the frequency distribution with a frequency
polygon . - c. Create a cumulative frequency distribution of the outstanding shares.
- d. Display the cumulative frequency distribution with a cumulative frequency polygon.
- e. Based on the cumulative relative frequency distribution, 75% of the companies have less than “what number” of outstanding shares?
- f. Write a brief analysis of this group of companies based on your statistical summaries of “number of outstanding shares.”
a.
Construct a frequency distribution for the given table.
Answer to Problem 38CE
The frequency distribution for the publicly traded companies is given below:
| Outstanding shares |
Number of companies |
| 0–400 | 10 |
| 400–800 | 8 |
| 800–1,200 | 4 |
| 1,200–1,600 | 1 |
| 1,600–2,000 | 1 |
| Total | 24 |
Explanation of Solution
Selection of number of classes:
The “2 to the k rule” suggests that the number of classes is the smallest value of k, where
It is given that the data set consists of 24 observations. The value of k can be obtained as follows:
Here,
Therefore, the number of classes for the given data set is 5.
From the given data set, the maximum and minimum values are 1,957 and 22, respectively.
The formula for the class interval is given as follows:
where i is the class interval and k is the number of classes.
Therefore, the class interval for the given data can be obtained as follows:
In practice, the class interval size is usually rounded up to some convenient number. Therefore, the reasonable class interval is 400.
Frequency distribution:
The frequency table is a collection of mutually exclusive and exhaustive classes, which shows the number of observations in each class.
Since the minimum value is 22 and the class interval is 400, the first class would be 0–400. The frequency distribution for the publicly traded companies can be constructed as follows:
| Outstanding shares |
Number of companies |
| 0–400 | 10 |
| 400–800 | 8 |
| 800–1,200 | 4 |
| 1,200–1,600 | 1 |
| 1,600–2,000 | 1 |
| Total | 24 |
b.
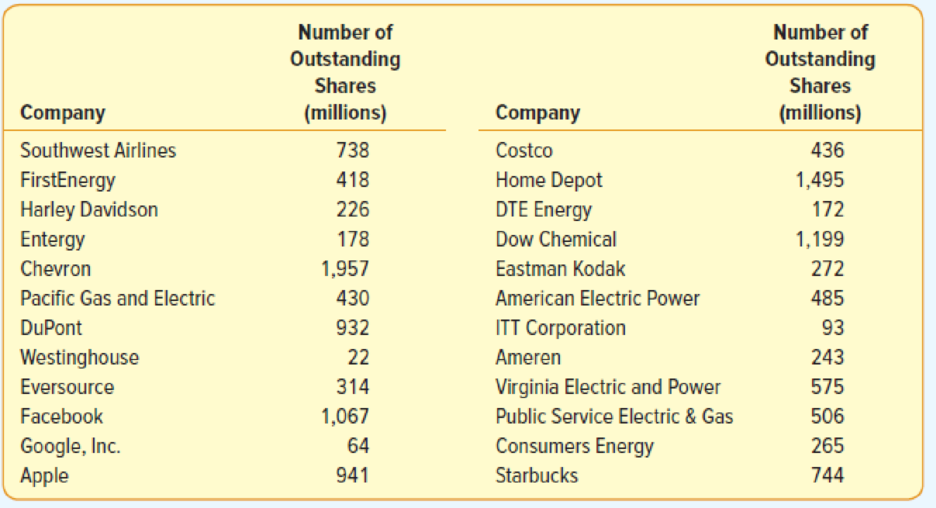
Create a frequency polygon for the frequency distribution.
Answer to Problem 38CE
The frequency polygon for the given data is as follows:
Explanation of Solution
For the given data set, the frequency table with mid-points of classes is obtained as follows:
| Outstanding shares | Mid-point |
Number of companies |
| 0–400 | 10 | |
| 400–800 | 8 | |
| 800–1,200 | 4 | |
| 1,200–1,600 | 1 | |
| 1,600–2,000 | 1 | |
| Total | 24 |
The frequency polygon for the given data can be drawn using EXCEL.
Step-by-step procedure to obtain the frequency polygon using EXCEL:
- Enter the column of midpoints along with the frequency column.
- Select the total data range with labels.
- Go to Insert > Charts > line chart.
- Select the appropriate line chart.
- Click OK.
c.
Create a cumulative frequency distribution for the given table.
Answer to Problem 38CE
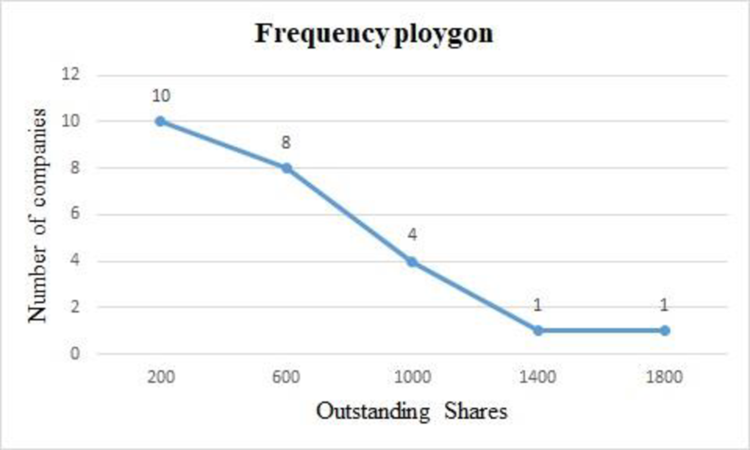
The cumulative frequency distribution is given below:
| Outstanding shares |
Number of companies |
Cumulative frequency |
| 0–400 | 10 | 10 |
| 400–800 | 8 | 18 |
| 800–1,200 | 4 | 22 |
| 1,200–1,600 | 1 | 23 |
| 1,600–2,000 | 1 | 24 |
| Total | 24 |
Explanation of Solution
The cumulative frequency distribution for the frequency table in Part (a) can be constructed as follows:
| Outstanding shares |
Number of companies |
Cumulative frequency |
| 0–400 | 10 | 10 |
| 400–800 | 8 | |
| 800–1,200 | 4 | |
| 1,200–1,600 | 1 | |
| 1,600–2,000 | 1 | |
| Total | 24 |
d.
Create a cumulative frequency polygon for the frequency distribution.
Answer to Problem 38CE
The cumulative frequency polygon for the given data is as follows:
Explanation of Solution
For the given data set, the cumulative frequency table with mid-points of classes is obtained as follows:
| Outstanding shares | Mid-point |
Cumulative frequency for Number of companies |
| 0–400 | 10 | |
| 400–800 | 18 | |
| 800–1,200 | 22 | |
| 1,200–1,600 | 23 | |
| 1,600–2,000 | 24 |
The cumulative frequency polygon for the given data can be drawn using EXCEL.
Step-by-step procedure to obtain the frequency polygon using EXCEL:
- Enter the column of midpoints along with the cumulative frequency column.
- Select the total data range with labels.
- Go to Insert > Charts > line chart.
- Select the appropriate line chart.
- Click OK.
e.
Find the number of outstanding shares that 75% of the companies have below than it.
Answer to Problem 38CE
Approximately 75% of the companies have less than 600 outstanding shares.
Explanation of Solution
75% of the total 24 companies are 18 companies. From the given cumulative frequency polygon, the value on the outstanding shares axis corresponding to 18 on the number of companies’ axis is 600. Therefore, approximately 75% of the companies have less than 600 outstanding shares.
f.
Give an explanation about the analysis of the number of outstanding shares.
Explanation of Solution
From the cumulative frequency distribution in Part (d), 18 out of 24 companies have less than 600 million shares. Only 2 companies have more than 1200 million shares. Thus, the distribution of number of outstanding shares is positively skewed.
Want to see more full solutions like this?
Chapter 2 Solutions
EBK STATISTICAL TECHNIQUES IN BUSINESS


 Glencoe Algebra 1, Student Edition, 9780079039897...AlgebraISBN:9780079039897Author:CarterPublisher:McGraw Hill