
STAT TECH IN BUSINESS & ECON AC
18th Edition
ISBN: 9781264731657
Author: Lind
Publisher: MCG
expand_more
expand_more
format_list_bulleted
Concept explainers
Videos
Textbook Question
Chapter 2, Problem 39CE
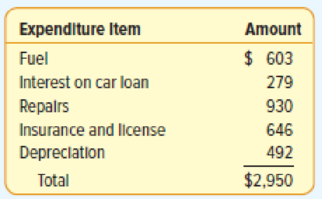
A recent survey showed that the typical American car owner spends $2,950 per year on operating expenses. Below is a breakdown of the various expenditure items. Draw an appropriate chart to portray the data and summarize your findings in a brief report.
Expert Solution & Answer
Want to see the full answer?
Check out a sample textbook solution
Students have asked these similar questions
In 2011 home prices and mortgage rates dropped so low that in a number of cities the monthly cost of owning a home was less expensive than renting. The following data show the average asking rent for 10 markets and the monthly mortgage on the median priced home (including taxes and insurance) for 10 cities where the average monthly mortgage payment was less than the average asking rent (The Wall Street Journal, November 26–27, 2011).Click on the datafile logo to reference the data.
Enter negative values as negative numbers.
a. Develop the estimated regression equation that can be used to predict the monthly mortgage given the average asking rent (to 2 decimals).The regression equation is:Mortgage ($) = + Rent ($)
What would be a suitable chart type to show the proportions of the sales by products?
Total revenue for a soda in January 2011 was $4,342,262, and total revenue in January 2013 was $4,429,964. See the data below. The soda company is requesting your help as manager to understand how price increases are affecting the quantity of sodas sold.
Create a table with the descriptive statistics of the number of sodas sold in the two years, as well as an explanation of the descriptive statistics: What are some of the key aspects of the descriptive statistics that help you tell a story about the 2 years in sodas sold.
Run a regression where you explain how price changes are affecting the quantity of sodas sold. Include an explanation of the coefficients as well as an explanation of the t-statistics, the intercept, the R-Squared, and the F-Statistic.
Explain managerial recommendations to the soda company on how can you increase the revenue.
Chapter 2 Solutions
STAT TECH IN BUSINESS & ECON AC
Ch. 2 - DeCenzo Specialty Food and Beverage Company has...Ch. 2 - A pie chart shows the relative market share of...Ch. 2 - In a marketing study, 100 consumers were asked to...Ch. 2 - A total of 1,000 residents in Minnesota were asked...Ch. 2 - Two thousand frequent business travelers are asked...Ch. 2 - Wellstone Inc. produces and markets replacement...Ch. 2 - A small business consultant is investigating the...Ch. 2 - In the first quarter of last year, the 11 members...Ch. 2 - Prob. 3SRCh. 2 - A set of data consists of 38 observations. How...
Ch. 2 - A set of data consists of 45 observations between...Ch. 2 - A set of data consists of 230 observations between...Ch. 2 - A set of data contains 53 observations. The...Ch. 2 - Wachesaw Manufacturing Inc. produced the following...Ch. 2 - The Quick Change Oil Company has a number of...Ch. 2 - The manager of the BiLo Supermarket in Mt....Ch. 2 - The food services division of Cedar River...Ch. 2 - The annual imports of a selected group of...Ch. 2 - Mollys Candle Shop has several retail stores in...Ch. 2 - The following chart shows the number of patients...Ch. 2 - The following frequency distribution reports the...Ch. 2 - Prob. 18ECh. 2 - A sample of the hourly wages of 15 employees at...Ch. 2 - The following cumulative frequency and the...Ch. 2 - The cumulative frequency and the cumulative...Ch. 2 - The frequency distribution representing the number...Ch. 2 - Prob. 22ECh. 2 - Describe the similarities and differences of...Ch. 2 - Describe the similarities and differences between...Ch. 2 - Alexandra Damonte will be building a new resort in...Ch. 2 - Prob. 26CECh. 2 - A data set consists of 83 observations. How many...Ch. 2 - A data set consists of 145 observations that range...Ch. 2 - The following is the number of minutes to commute...Ch. 2 - The following data give the weekly amounts spent...Ch. 2 - A social scientist is studying the use of iPods by...Ch. 2 - David Wise handles his own investment portfolio,...Ch. 2 - Prob. 33CECh. 2 - The monthly issues of the Journal of Finance are...Ch. 2 - The following histogram shows the scores on the...Ch. 2 - The following chart summarizes the selling price...Ch. 2 - A chain of sport shops catering to beginning...Ch. 2 - Prob. 38CECh. 2 - A recent survey showed that the typical American...Ch. 2 - Midland National Bank selected a sample of 40...Ch. 2 - Residents of the state of South Carolina earned a...Ch. 2 - A recent study of home technologies reported the...Ch. 2 - Merrill Lynch recently completed a study regarding...Ch. 2 - Prob. 44CECh. 2 - Refer to the following chart: a. What is the name...Ch. 2 - The following chart depicts the annual revenues,...Ch. 2 - Prob. 47CECh. 2 - Prob. 48CECh. 2 - One of the most popular candies in the United...Ch. 2 - The number of families who used the Minneapolis...Ch. 2 - Refer to the North Valley Real Estate data that...Ch. 2 - Prob. 52DACh. 2 - Refer to the Lincolnville School District bus...
Knowledge Booster


Learn more about
Need a deep-dive on the concept behind this application? Look no further. Learn more about this topic, statistics and related others by exploring similar questions and additional content below.Similar questions
- If you graph a revenue and cost function, explain how to determine in what regions there is profit.arrow_forwardU.S. Census data shows that the median price of new home in the United States in November 2014 was $280,900. This was $10,700 more than 14 times the price in November 1964. What was the median price of a new home in November 1964?arrow_forwardThe data in the picture contains purchase data for golf purchases. Create a doughnut chart in Excel to compare the purchases by gender each year with the US population. Below the chart, explain what it illustrates.arrow_forward
- Please show all work and Excel use/steps.arrow_forwardResearchers initiated a long-term study of the population of American black bears. One aspect of the study was to develop a model that could be used to predict a bear's weight (since it is not practical to weigh bears in the field). One variable thought to be related to weight is the length of the bear. The accompanying data represent the lengths and weights of 12 American black bears. Complete parts (a) through (d) below. Click the icon to view the data table. Click the icon to view the critical values table. ..... (a) Which variable is the explanatory variable based on the goals of the research? O A. The number of bears B. The weight of the bear O C. The length of the bear (b) Draw a scatter diagram of the data. Choose the correct graph below. O A. O B. O C. D. A Weight (kg) 180- AWeight (kg) 180- ALength (cm) 180- A Weight (kg) 180- 40- 100 40- 100 Length (cm) 40- 100 40- 100 200 200 200 200 Length (cm) Weight (kg) Length (cm) (c) Determine the linear correlation coefficient between…arrow_forwardPlease help with (d)arrow_forward
- A high school guidance counselor analyzed data from a sample of 200 community colleges throughout the United States. One of his goals was to estimate the annual tuition costs of community colleges in the United States. Describe the population and variable of interest to the guidance counselor. Why?arrow_forwardGoogle has changed its strategy with regard to how much and over which media it invests in advertising. The following table shows Google's marketing budget in millions of dollars for 2008 and 2011 (The Wall Street Journal, March 27, 2012). 2008 2011 Internet $26.0 $123.3 Newspaper, etc. $4.0 $20.7 Television $0.0 $69.3 a. Select a side-by-side bar chart with year as the variable on the horizontal axis.arrow_forwardThe owner of Showtime Movie Theaters, Inc., would like to predict weekly gross revenue as a function of advertising expenditures. Historical data for a sample of eight weeks follow. Click on the datafile logo to reference the data .arrow_forward
- badly needed right now, pleasearrow_forwardThe Toyota Camry is one of the best-selling cars in North America. The cost of a previously owned Camry depends on many factors, including the model year, mileage, and condition. To investigate the relationship between the car's mileage and the sales price for Camrys, the following data show the mileage and sale price for 19 sales (PriceHub web site, February 24, 2012). DATA file Miles (1,000s) Price ($1,000s) 22 16.2 29 16.0 36 13.8 47 11.5 63 12.5 77 12.9 73 11.2 87 13.0 92 11.8 101 10.8 110 8.3 28 12.5 59 11.1 68 15.0 68 12.2 91 13.0 42 15.6 65 12.7 110 8.3arrow_forwardPlease show steps in Excel. The 32 teams in the National Football League (NFL) are worth, on average, $1.17 billion, 5% more than last year. The datafile NFLTEAMVALUE shows the annual revenue ($millions) and the estimated team value ($ millions) for the 32 NFL teams (Forbes website, February 28, 2014). a.Develop a scatter diagram with Revenue on the horizontal axis and Value on the vertical axis. Does there appear that there is any relationship between the two variables? b. What is the sample correlation coefficient? What can you say about the strength of the relationship between Revenue and Value? Team Revenue ($ millions) Current Value ($ millions) Arizona Cardinals 253 961 Atlanta Falcons 252 933 Baltimore Ravens 292 1,227 Buffalo Bills 256 870 Carolina Panthers 271 1,057 Chicago Bears 298 1,252 Cincinnati Bengals 250 924 Cleveland Browns 264 1,005 Dallas Cowboys 539 2,300 Denver Broncos 283 1,161 Detroit Lions 248 900 Green Bay Packers 282 1,183 Houston…arrow_forward
arrow_back_ios
SEE MORE QUESTIONS
arrow_forward_ios
Recommended textbooks for you
 Elementary AlgebraAlgebraISBN:9780998625713Author:Lynn Marecek, MaryAnne Anthony-SmithPublisher:OpenStax - Rice University
 Mathematics For Machine TechnologyAdvanced MathISBN:9781337798310Author:Peterson, John.Publisher:Cengage Learning,
 Glencoe Algebra 1, Student Edition, 9780079039897...AlgebraISBN:9780079039897Author:CarterPublisher:McGraw Hill
 Holt Mcdougal Larson Pre-algebra: Student Edition...AlgebraISBN:9780547587776Author:HOLT MCDOUGALPublisher:HOLT MCDOUGAL
 Big Ideas Math A Bridge To Success Algebra 1: Stu...AlgebraISBN:9781680331141Author:HOUGHTON MIFFLIN HARCOURTPublisher:Houghton Mifflin Harcourt
Elementary Algebra
Algebra
ISBN:9780998625713
Author:Lynn Marecek, MaryAnne Anthony-Smith
Publisher:OpenStax - Rice University
Mathematics For Machine Technology
Advanced Math
ISBN:9781337798310
Author:Peterson, John.
Publisher:Cengage Learning,
Glencoe Algebra 1, Student Edition, 9780079039897...
Algebra
ISBN:9780079039897
Author:Carter
Publisher:McGraw Hill
Holt Mcdougal Larson Pre-algebra: Student Edition...
Algebra
ISBN:9780547587776
Author:HOLT MCDOUGAL
Publisher:HOLT MCDOUGAL
Big Ideas Math A Bridge To Success Algebra 1: Stu...
Algebra
ISBN:9781680331141
Author:HOUGHTON MIFFLIN HARCOURT
Publisher:Houghton Mifflin Harcourt
Which is the best chart: Selecting among 14 types of charts Part II; Author: 365 Data Science;https://www.youtube.com/watch?v=qGaIB-bRn-A;License: Standard YouTube License, CC-BY