
Videos
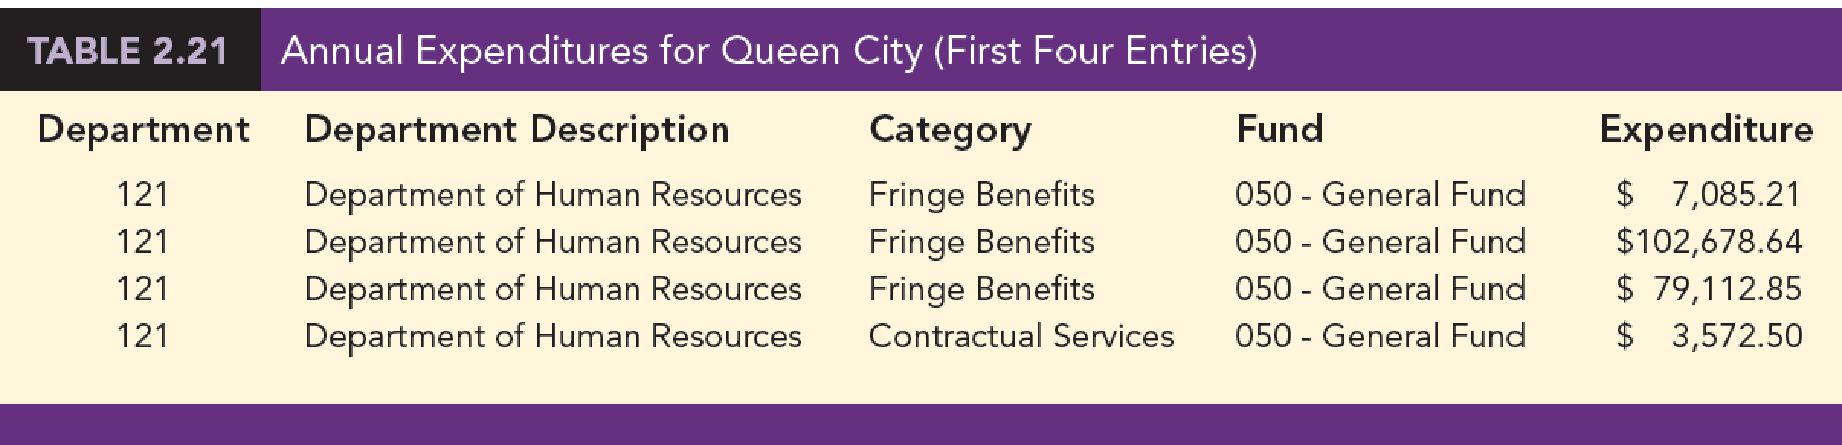
Cincinnati, Ohio, also known as the Queen City, has a population of approximately 298,000 and is the third largest city in the state of Ohio. The Cincinnati metropolitan area has a population of about 2.2 million. The city is governed by a mayor and a nine-member city council. The city manager, who is responsible for the day-to-day operation of the city, reports to the mayor and city council. The city manager recently created the Office of Performance and Data Analytics with the goal of improving the efficiency of city operations. One of the first tasks of this new office is to review the previous year’s expenditures. The file QueenCity contains data on the previous year’s expenditures, including the following:
Department: The number of the department incurring the expenditure
Department Description: The name of the department incurring the description
Category: The category of the expenditure
Fund: The fund to which the expenditure was charged
Expenditure: The dollar amount of the expense
Table 2.21 shows the first four entries of the 5427 expenditures for the year. The city manager would like to use this data to better understand how the city’s budget is being spent.
Manageri al Report
Use tabular and graphical methods of
- 1. Tables and/or graphical displays that show the amount of expenditures by category and percentage of total expenditures by category.
- 2. A table that shows the amount of expenditures by department and the percentage of total expenditures by department. Combine any department with less than 1% into a category named “Other.”
- 3. A table that shows the amount of expenditures by fund and the percentage of total expenditures by fund. Combine any fund with less than 1% into a category named “Other.”
1.
Make tabular and graphical displays that show the amount of expenditure by category and percentage of total expenditures by category.
Answer to Problem 3CP
The following table represents the total amount of expenditure by category and percentage of total expenditures by category:
| Category | Total expenditure | Percentage of total expenditure |
| Capital | $198,365,854 | 29.98% |
| Payroll | $145,017,555 | 21.92% |
| Debt service | $86,913,978 | 13.14% |
| Contractual services | $85,043,249 | 12.85% |
| Fringe benefits | $66,053,340 | 9.98% |
| Fixed costs | $53,732,177 | 8.12% |
| Materials and supplies | $19,934,710 | 3.01% |
| Inventory | $6,393,394 | 0.97% |
| Payables | $180,435 | 0.03% |
| Grand Total | $661,634,693 | 100.0% |
The bar chart for “Category” is given below:

Explanation of Solution
Calculation:
The table represents the sample of 5,427 entries and the annual expenditures for queen city (City C and City O) for the year. The five types of variables present in the data are department serial number, department description, category name, fund, and expenditure.
From the data set, the variable “Category” consists of nine entities, namely capital, payroll, debt service, contractual services, fringe benefits, fixed costs, materials and supplies, inventory, and payable.
Therefore, the following table shows the amount of all nine entities’ total expenditure by category:
| Category | Total expenditure |
| Capital | $198,365,854 |
| Payroll | $145,017,555 |
| Debt service | $86,913,978 |
| Contractual services | $85,043,249 |
| Fringe benefits | $66,053,340 |
| Fixed costs | $53,732,177 |
| Materials and supplies | $19,934,710 |
| Inventory | $6,393,394 |
| Payables | $180,435 |
| Grand Total | $661,634,693 |
The percentage for capital is calculated as the ratio of total expenditure for capital to the grand totals of all categories.
The following table shows the percentage of amount of all nine entities’ total expenditure by category:
| Category | Total expenditure | Percentage of total expenditure |
| Capital | $198,365,854 | 29.98% |
| Payroll | $145,017,555 | 21.92% |
| Debt service | $86,913,978 | 13.14% |
| Contractual services | $85,043,249 | 12.85% |
| Fringe benefits | $66,053,340 | 9.98% |
| Fixed costs | $53,732,177 | 8.12% |
| Materials and supplies | $19,934,710 | 3.01% |
| Inventory | $6,393,394 | 0.97% |
| Payables | $180,435 | 0.03% |
| Grand Total | $661,634,693 | 100.0% |
Software procedure:
Step-by-step software procedure to obtain the bar chart for category using EXCEL software:
- In Excel sheet, enter Category in one column and Percentage of total Expenditure in another column.
- Select the data, and then choose Insert > Insert Column Bar Charts.
- Select Clustered Column under More Column Charts.
Output using the EXCEL software is given below:
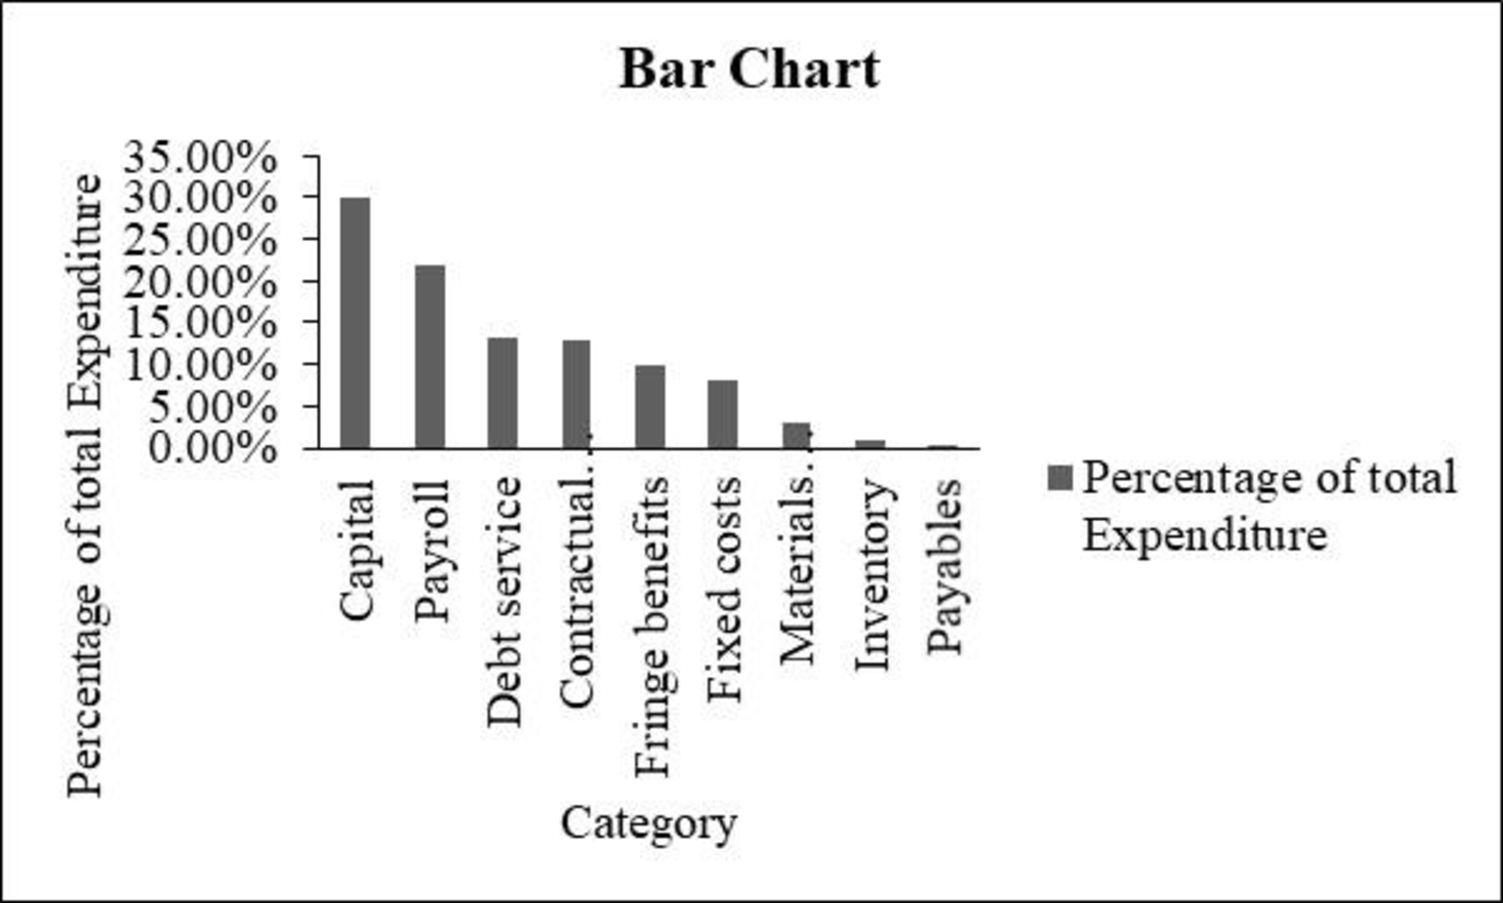
From the obtained table and bar chart, it can be observed that the sum of capital expenditures and payroll contributes 50% of all expenditures.
Also, the total expenditures are over $660 million. Debt service seems to be high, and it is found to be over 10% of total expenditures.
2.
Make tabular displays that show the amount of expenditure by department and percentage of total expenditures by department.
Answer to Problem 3CP
The following table represents the total amount of expenditure by department and percentage of total expenditures by department:
| Department description | Percentage of total expenditure | Total expenditure |
| Department of Police | 9.72% | 64,295,941 |
| Department of Sewers | 8.76% | 57,954,955 |
| Transportation and Engineering | 8.72% | 57,686,199 |
| Department of Fire | 7.23% | 47,838,396 |
| Sewers, Debt Service | 6.59% | 43,585,814 |
| Finance, Risk Management | 5.39% | 35,654,238 |
| SORTA Operations | 3.62% | 23,975,000 |
| Water Works, Debt Service | 3.24% | 21,418,102 |
| Department of Water Works | 3.07% | 20,307,505 |
| Finance, Treasury | 2.80% | 18,531,650 |
| Economic Development | 2.13% | 14,078,735 |
| Division of Parking Facilities | 1.89% | 12,489,731 |
| Community Development, Housing | 1.75% | 11,556,943 |
| Enterprise Technology Solutions | 1.71% | 11,314,215 |
| Public Services, Fleet Services | 1.66% | 10,982,312 |
| Finance, Accounts & Audits | 1.66% | 10,960,345 |
| Transportation and Engineering, Planning | 1.63% | 10,764,138 |
| Public Services, Neighborhood Operations | 1.38% | 9,140,769 |
| Sewers, Millcreek | 1.30% | 8,575,226 |
| Health, Primary Health Care Centers | 1.25% | 8,268,632 |
| Water Works, Water Supply | 1.19% | 7,883,099 |
| Public Services, Facilities Management | 1.13% | 7,469,863 |
| Sewers, Wastewater Administration | 1.01% | 6,668,240 |
| Other department less than 1 percent each | 21.2% | 140,234,644 |
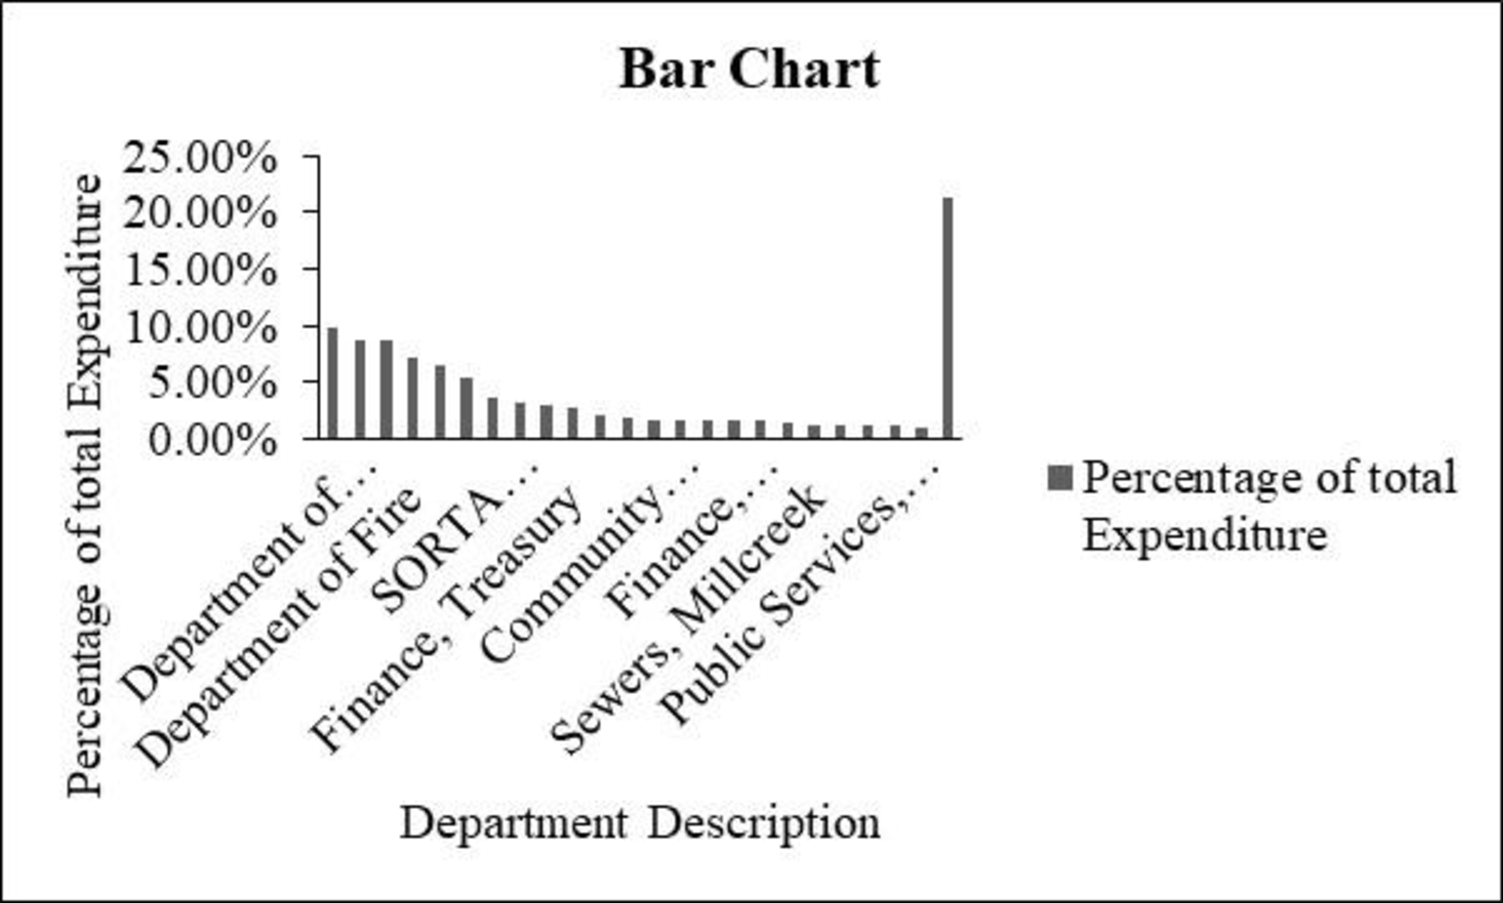
The bar chart for “Department description” is given below:

Explanation of Solution
Calculation:
Here, any departments with less than 1% are combined into a category named “other”.
Department description with less than 1% is tabulated as follows and named as “other”:
| Other (department description less than 1%) | Percentage of total expenditure | Total expenditure |
| Water Works, Distribution | 0.98% | 6,490,554 |
| Public Services, Traffic and Road Operations | 0.89% | 5,884,799 |
| Parks, Administrative and Program Services | 0.87% | 5,744,316 |
| Water Works, Commercial Services | 0.81% | 5,360,380 |
| Sewers, Wastewater Collection | 0.81% | 5,331,756 |
| Sewers, Director/Storm water | 0.79% | 5,213,170 |
| Parks, Operations and Facility Mgmt | 0.76% | 5,008,200 |
| Police Emergency Communications | 0.69% | 4,557,589 |
| Division of Convention Center | 0.67% | 4,460,267 |
| Health, Primary Health Care Programs | 0.58% | 3,821,334 |
| Health, Community Health Services | 0.56% | 3,675,649 |
| Sewers, Maintenance | 0.55% | 3,668,040 |
| Water Works, Water Quality and Treatment | 0.51% | 3,395,988 |
| Recreation, Support Services | 0.50% | 3,315,938 |
| Law Department | 0.47% | 3,078,594 |
| Recreation, Golf | 0.42% | 2,781,652 |
| Water Works, Business Services | 0.41% | 2,693,873 |
| New Construction & Building Standards | 0.40% | 2,677,798 |
| Water Works, Engineering | 0.39% | 2,583,805 |
| Division of Traffic Engineering | 0.38% | 2,504,453 |
| Cincinnati Public School Reserve | 0.38% | 2,500,000 |
| Sewers, Little Miami | 0.37% | 2,439,869 |
| Planning, Licenses & Permits | 0.36% | 2,371,973 |
| Workers' Compensation Insurance | 0.33% | 2,214,094 |
| Motorized and Construction Equipment | 0.33% | 2,187,298 |
| Recreation, Maintenance | 0.33% | 2,162,545 |
| General Fund Overhead | 0.32% | 2,095,756 |
| Health, Primary School &Adolescent | 0.31% | 2,074,254 |
| Community Development Administration | 0.30% | 1,968,773 |
| Sewers, Industrial Waste | 0.28% | 1,841,374 |
| Office of the City Manager | 0.26% | 1,712,437 |
| Sewers, Project Delivery | 0.25% | 1,682,688 |
| Finance, Purchasing | 0.24% | 1,600,148 |
| Recreation, Athletics | 0.24% | 1,582,290 |
| Office of Environmental Qualities | 0.23% | 1,548,437 |
| Recreation, West Region | 0.22% | 1,487,931 |
| Finance, Income Tax | 0.22% | 1,483,479 |
| Health, Commissioner | 0.21% | 1,418,825 |
| Recreation, Central Region | 0.21% | 1,393,663 |
| Recreation, East Region | 0.20% | 1,350,682 |
| Community Development | 0.20% | 1,337,001 |
| Sewers, Muddy Creek | 0.18% | 1,211,584 |
| Health, Technical Resources | 0.17% | 1,122,229 |
| Sewers, Planning | 0.17% | 1,092,095 |
| Enterprise Software and Licenses | 0.16% | 1,082,024 |
| Water Works, IT | 0.16% | 1,039,488 |
| Sewers, Wastewater Engineering | 0.15% | 973,882 |
| Department of Human Resources | 0.14% | 929,460 |
| Department Of Planning & Buildings | 0.14% | 911,988 |
| Office and Technical Equipment | 0.13% | 863,762 |
| Bond Fund — Principal and Interest | 0.12% | 774,523 |
| Sewers, Sycamore | 0.11% | 754,132 |
| Transportation and Engineering Director | 0.11% | 720,092 |
| Division of Aviation | 0.11% | 702,480 |
| Budget & Evaluation | 0.08% | 562,270 |
| Sewers, Polk Run | 0.08% | 532,890 |
| Sewers, Taylor Creek | 0.08% | 529,774 |
| Citizens' Complaint Authority | 0.07% | 431,449 |
| Sewers, Superintendent | 0.06% | 428,268 |
| Contribution to Fire Pension | 0.06% | 416,783 |
| Contribution to Police Pension | 0.06% | 400,439 |
| Public Services, Director | 0.06% | 397,815 |
| Port Authority Greater Cincinnati Development | 0.05% | 350,000 |
| City Council | 0.05% | 337,658 |
| Hamilton Co. Auditor & Treasurer Fees | 0.05% | 298,758 |
| Office of The Clerk of Council | 0.04% | 293,185 |
| Office of The Mayor | 0.04% | 287,622 |
| Lump Sum Payments | 0.04% | 252,054 |
| Finance Director’s Office | 0.03% | 213,548 |
| County Clerk Fees | 0.03% | 175,000 |
| Public Employees Assistance Program | 0.02% | 161,711 |
| Police and Fire Fighter's Insurance | 0.02% | 115,000 |
| Parks, Office of Director | 0.01% | 94,987 |
| Special Investigations/Studies | 0.01% | 92,210 |
| Councilmember PG Sittenfeld | 0.01% | 77,451 |
| Surplus | 0.01% | 76,091 |
| Councilmember Y. Simpson | 0.01% | 70,985 |
| Councilmember W. Young | 0.01% | 63,012 |
| Councilmember R. Qualls | 0.01% | 62,862 |
| Councilmember C. Seelbach | 0.01% | 60,177 |
| Councilmember Quinlivan | 0.01% | 57,685 |
| Councilmember C. Winburn | 0.01% | 57,654 |
| Downtown Special Improvement District | 0.01% | 56,000 |
| Memberships & Publications | 0.01% | 53,150 |
| Cincinnati Music Hall | 0.01% | 50,000 |
| Election Expense | 0.01% | 46,580 |
| Convention Facility Authority | 0.01% | 45,700 |
| Councilmember C. Thomas | 0.01% | 45,603 |
| Councilmember C. Smitherman | 0.01% | 43,141 |
| Mayor's Office Obligations | 0.01% | 41,194 |
| State Unemployment Comp | 0.00% | 31,671 |
| Manager's Office Obligations | 0.00% | 13,956 |
| Councilmember P. Thomas | 0.00% | 13,168 |
| Judgments Against the City | 0.00% | 7,644 |
| Department of Public Recreation | 0.00% | 5,093 |
| Audit & Examiners Fees | 0.00% | 5,000 |
From the data set, the variable “department description” has 119 different departments, out of which 96 departments’ percentage is less than 1.
Therefore, the following table shows the expenditure of all 119 different departments:
| Department description | Total expenditure |
| Department of Police | 64,295,941 |
| Department of Sewers | 57,954,955 |
| Transportation and Engineering | 57,686,199 |
| Department of Fire | 47,838,396 |
| Sewers, Debt Service | 43,585,814 |
| Finance, Risk Management | 35,654,238 |
| SORTA Operations | 23,975,000 |
| Water Works, Debt Service | 21,418,102 |
| Department of Water Works | 20,307,505 |
| Finance, Treasury | 18,531,650 |
| Economic Development | 14,078,735 |
| Division of Parking Facilities | 12,489,731 |
| Community Development, Housing | 11,556,943 |
| Enterprise Technology Solutions | 11,314,215 |
| Public Services, Fleet Services | 10,982,312 |
| Finance, Accounts & Audits | 10,960,345 |
| Transportation and Engineering, Planning | 10,764,138 |
| Public Services, Neighborhood Operations | 9,140,769 |
| Sewers, Millcreek | 8,575,226 |
| Health, Primary Health Care Centers | 8,268,632 |
| Water Works, Water Supply | 7,883,099 |
| Public Services, Facilities Management | 7,469,863 |
| Sewers, Wastewater Administration | 6,668,240 |
| Other department less than 1 percent each | 140,234,644 |
| Grand Total | 661,634,692 |
The percentage for department description is calculated as the ratio of total expenditure to the grand total of all departments.
Therefore, the following table shows the percentage of amount of all department total expenditure by department:
| Department description | Percentage of total expenditure |
| Department of Police | 9.72% |
| Department of Sewers | 8.76% |
| Transportation and Engineering | 8.72% |
| Department of Fire | 7.23% |
| Sewers, Debt Service | 6.59% |
| Finance, Risk Management | 5.39% |
| SORTA Operations | 3.62% |
| Water Works, Debt Service | 3.24% |
| Department of Water Works | 3.07% |
| Finance, Treasury | 2.80% |
| Economic Development | 2.13% |
| Division of Parking Facilities | 1.89% |
| Community Development, Housing | 1.75% |
| Enterprise Technology Solutions | 1.71% |
| Public Services, Fleet Services | 1.66% |
| Finance, Accounts & Audits | 1.66% |
| Transportation and Engineering, Planning | 1.63% |
| Public Services, Neighborhood Operations | 1.38% |
| Sewers, Millcreek | 1.30% |
| Health, Primary Health Care Centers | 1.25% |
| Water Works, Water Supply | 1.19% |
| Public Services, Facilities Management | 1.13% |
| Sewers, Wastewater Administration | 1.01% |
| Other department less than 1 percent each | 21.2% |
Software procedure:
Step-by-step software procedure to obtain bar chart for department using EXCEL software:
- In Excel sheet, enter Department Description in one column and Percentage of total Expenditure in another column.
- Select the data, and then choose Insert > Insert Column Bar Charts.
- Select Clustered Column under More Column Charts.
Output using the Excel is given below:
Interpretation:
- From the obtained table and bar chart, it can be observed that 96 departments are showing total expenditure less than 1% over 119 departments.
- There are six individual departments, namely police, sewers, transportation and engineering, fire, sewer debt service, and financial/risk management, They have the total expenditure approximately 5 percent and more.
- Further, other department less than 1 percent each seems to be high, in terms of total expenditure percentage.
3.
Make tabular displays that show the amount of expenditure by fund and percentage of total expenditures by fund and combine any department with less than 1% into a category named “other”.
Answer to Problem 3CP
The following table represents the total amount of expenditure by fund and percentage of total expenditures by fund:
| Fund | Total expenditure | Percentage of total expenditure |
| 050 - general fund | 168,607,659 | 25.5% |
| 980 - capital projects | 106,180,470 | 16.0% |
| 701 - metropolitan sewer district of greater Cincinnati | 83,713,741 | 12.7% |
| 704 - metropolitan sewer district capital improvements | 57,954,955 | 8.8% |
| 101 - water works | 52,292,202 | 7.9% |
| 711 - risk management | 32,380,425 | 4.9% |
| 759 - income tax - transit | 24,239,259 | 3.7% |
| 151 - bond retirement - city | 15,584,916 | 2.4% |
| 202 - fleet services | 10,994,649 | 1.7% |
| 898 - water works improvement 12 | 8,483,304 | 1.3% |
| 897 - water works improvement 11 | 8,434,379 | 1.3% |
| 302 - income tax - infrastructure | 7,102,773 | 1.1% |
| other (less than 1% each) | 8,56,65,960 | 12.9% |
| Grand Total | 661,634,693 | 100.0% |
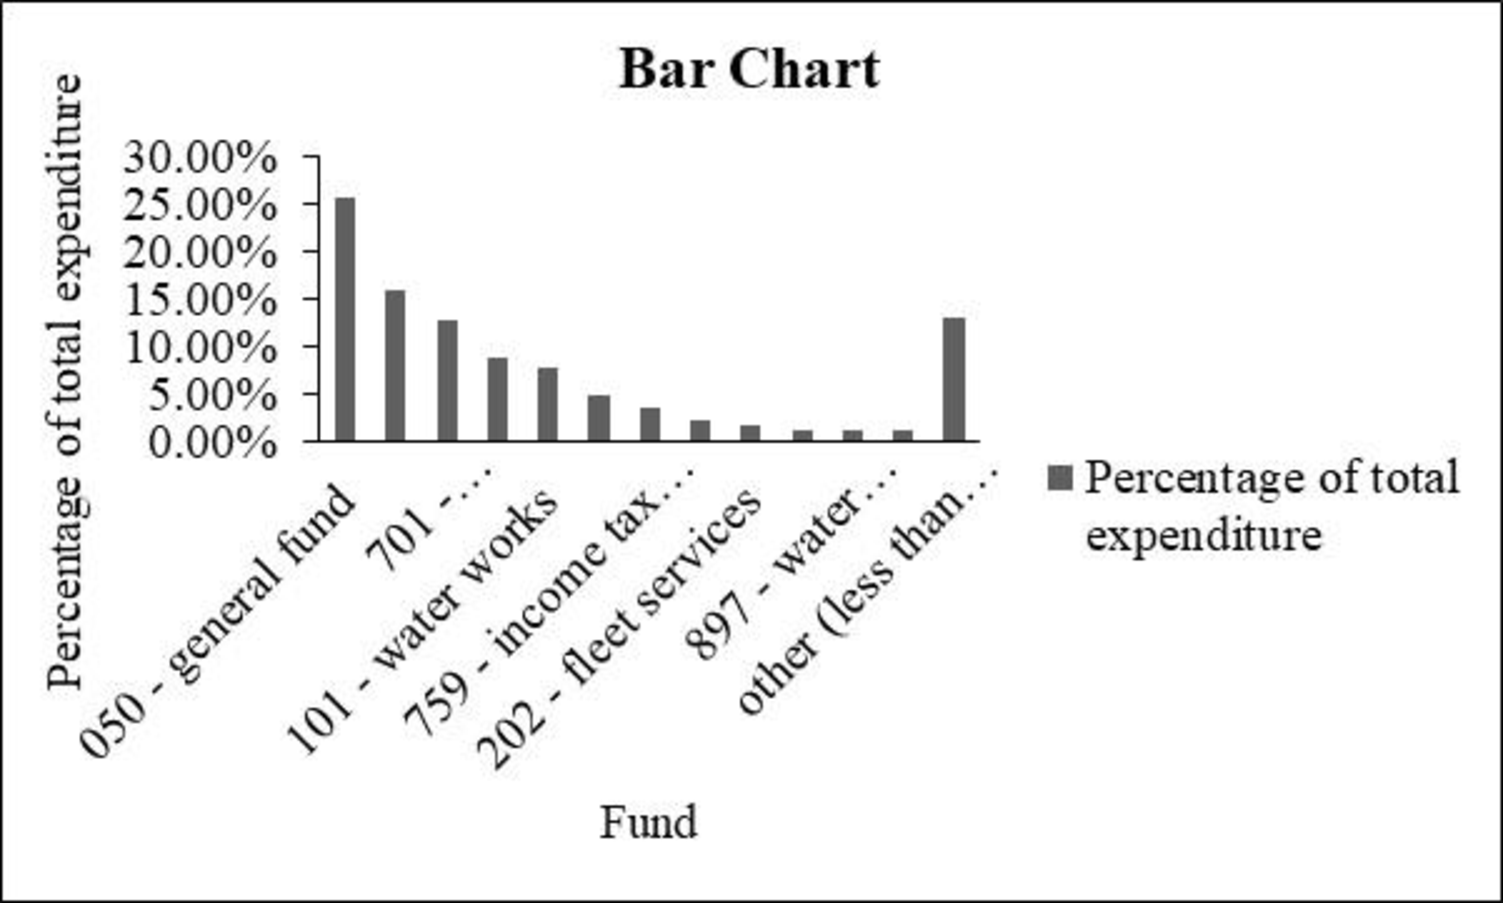
The bar chart for “Fund” is given below:

Explanation of Solution
Calculation:
Fund with less than 1% is tabulated below and named as “other”:
| Other (Fund less than 1%) | Total expenditure | Percentage of total expenditure |
| 155 – u square revenue bonds -trustee | 4,748,810 | 0.80% |
| 304 - community development block grant | 4,696,312 | 0.70% |
| 301 - street construction, maintenance and repair | 4,053,506 | 0.70% |
| 103 - duke energy convention center | 3,508,157 | 0.60% |
| 102 - parking system facilities | 3,388,305 | 0.50% |
| 702 - enterprise technology solutions | 3,216,237 | 0.50% |
| 762 - urban redevelopment tax increment equivalent | 2,816,029 | 0.50% |
| 105 - municipal golf activities | 2,596,303 | 0.40% |
| 395 - health services | 2,411,634 | 0.40% |
| 107 – storm water management | 2,325,888 | 0.40% |
| 368 - law enforcement grant | 2,222,595 | 0.40% |
| 410 - shelter plus care program | 2,162,535 | 0.30% |
| 449 - Cincinnati area’s geographic information system (cagis) | 2,159,283 | 0.30% |
| 353 - home health services | 2,099,548 | 0.30% |
| 457 - clear fund | 1,957,914 | 0.30% |
| 213 - worker's compensation | 1,817,200 | 0.30% |
| 758 - income tax permanent improvement fund | 1,766,123 | 0.30% |
| 214 - water works stores - chemicals | 1,526,281 | 0.30% |
| 204 - water works stores - materials | 1,506,447 | 0.20% |
| 391 - women and infants food grant program | 1,426,434 | 0.20% |
| 472 - fire grants | 1,362,498 | 0.20% |
| 307 - convention center expansion tax | 1,296,800 | 0.20% |
| 212 - employee safety and risk management | 1,216,265 | 0.20% |
| 491 - municipal public improvement equivalent fund | 1,212,813 | 0.20% |
| 438 - neighborhood stabilization program | 1,211,603 | 0.20% |
| 795 - downtown special improvement district | 1,202,786 | 0.20% |
| 201 - printing services/ stores | 1,141,805 | 0.20% |
| 306 - municipal motor vehicle license tax | 1,077,283 | 0.20% |
| 323 - recreation special activities | 1,069,119 | 0.20% |
| 411 - home investment trust | 991,223 | 0.20% |
| 349 - urban renewal debt retirement | 979,853 | 0.10% |
| 350 - public health research | 851,919 | 0.10% |
| 418 - federal health program income | 848,578 | 0.10% |
| 792 - forestry | 740,592 | 0.10% |
| 340 - centennial operations | 724,704 | 0.10% |
| 757 - miscellaneous permanent improvement fund | 662,729 | 0.10% |
| 104 - lunken airport | 586,663 | 0.10% |
| 487 - cuf/heights equivalent fund | 562,261 | 0.10% |
| 483 - downtown/otr east equivalent fund | 558,694 | 0.10% |
| 156 - fountain square west revenue bonds - trustee | 557,577 | 0.10% |
| 412 - food service license fees | 550,645 | 0.10% |
| 369 - criminal activity forfeiture - state | 523,925 | 0.10% |
| 488 –Coryville equivalent fund | 519,767 | 0.10% |
| 502 - arra federal grants | 509,814 | 0.10% |
| 445 - emergency shelter | 453,541 | 0.10% |
| 465 - housing opportunities for persons with aids | 373,929 | 0.10% |
| 498 –Madisonville equivalent fund | 363,449 | 0.10% |
| 332 - krohn conservatory | 302,862 | 0.10% |
| 364 - 911 cell phone fees | 299,652 | 0.00% |
| 381 - Cincinnati abatement project | 284,022 | 0.00% |
| 317 - urban development - property operations | 228,247 | 0.00% |
| 461 - fema grant | 219,424 | 0.00% |
| 793 - boulevard light energy and maintenance (blem) | 183,378 | 0.00% |
| 324 - recreation federal grant projects | 178,387 | 0.00% |
| 166 - greeters revenue bonds - trustee | 176,113 | 0.00% |
| 326 - park donations and special activity | 171,770 | 0.00% |
| 210 - highway maintenance stores | 169,814 | 0.00% |
| 342 - new city buildings operations | 167,023 | 0.00% |
| 420 - public employee assistance program | 165,141 | 0.00% |
| 446 - health network | 164,337 | 0.00% |
| 209 - property management | 162,435 | 0.00% |
| 618 - towing charges - private operators | 150,000 | 0.00% |
| 314 - special events | 146,679 | 0.00% |
| 481 - downtown south/riverfront equivalent fund | 144,066 | 0.00% |
| 367 - criminal activity forfeiture - federal | 131,116 | 0.00% |
| 753 - expressways/gateways | 126,717 | 0.00% |
| 486 - east walnut hills equivalent fund | 125,855 | 0.00% |
| 499 - Oakley equivalent fund | 123,924 | 0.00% |
| 436 - environmental studies | 122,482 | 0.00% |
| 318 - sawyer point | 115,771 | 0.00% |
| 330 - park lodge/pavilion deposits | 102,413 | 0.00% |
| 482 - downtown/otr west equivalent fund | 97,418 | 0.00% |
| 756 - water works capital | 78,225 | 0.00% |
| 485 - walnut hills equivalent fund | 77,402 | 0.00% |
| 207 - recreation stores | 76,091 | 0.00% |
| 161 - msd debt service - trustee - multi series | 71,262 | 0.00% |
| 752 - park board | 69,499 | 0.00% |
| 415 - immunization action plan | 63,781 | 0.00% |
| 478 - justice assistance grant | 56,049 | 0.00% |
| 425 - heart health in hamilton county project | 48,994 | 0.00% |
| 387 - lead hazard control research grant | 48,025 | 0.00% |
| 791 - sidewalks | 45,700 | 0.00% |
| 715 - convention facility authority | 44,830 | 0.00% |
| 454 –metropolitan medical response | 42,877 | 0.00% |
| 428 - urban forestry | 41,771 | 0.00% |
| 448 - health care services for the homeless | 41,475 | 0.00% |
| 370 - drug offender fines | 39,325 | 0.00% |
| 363 - solid waste disposal control | 38,714 | 0.00% |
| 490 - Evanston equivalent fund | 37,825 | 0.00% |
| 354 - household sewage treatment fees | 35,989 | 0.00% |
| 380 - lead poisoning control | 35,194 | 0.00% |
| 394 - state health program income | 29,632 | 0.00% |
| 413 - swimming pool license fees | 26,801 | 0.00% |
| 476 - uasi grant | 25,094 | 0.00% |
| 405 - market facilities | 24,099 | 0.00% |
| 389 - communications and marketing activities | 22,805 | 0.00% |
| other (less than 1% each) | 85,665,960 | 12.9% |
From the above table, the other category has the total expenditure of $85,665,960.
Therefore, the following table shows the amount of all 13 entities’ total expenditure by fund:
| Fund | Total expenditure |
| 050 - general fund | 168,607,659 |
| 980 - capital projects | 106,180,470 |
| 701 - metropolitan sewer district of greater Cincinnati | 83,713,741 |
| 704 - metropolitan sewer district capital improvements | 57,954,955 |
| 101 - water works | 52,292,202 |
| 711 - risk management | 32,380,425 |
| 759 - income tax – transit | 24,239,259 |
| 151 - bond retirement – city | 15,584,916 |
| 202 - fleet services | 10.994,649 |
| 898 - water works improvement 12 | 8,483,304 |
| 897 - water works improvement 11 | 8,434,379 |
| 302 - income tax – infrastructure | 7,102,773 |
| other (less than 1% each) | 85,665,960 |
| Total | 661,634,693 |
The percentage for fund is calculated as the ratio of total expenditure to the grand totals all funds.
Therefore, the following table shows the percentage of amount of all funds’ total expenditure by funds:
| Fund | Percentage of total expenditure |
| 050 - general fund | 25.5% |
| 980 - capital projects | 16.0% |
| 701 - metropolitan sewer district of greater Cincinnati | 12.7% |
| 704 - metropolitan sewer district capital improvements | 8.8% |
| 101 - water works | 7.9% |
| 711 - risk management | 4.9% |
| 759 - income tax - transit | 3.7% |
| 151 - bond retirement - city | 2.4% |
| 202 - fleet services | 1.7% |
| 898 - water works improvement 12 | 1.3% |
| 897 - water works improvement 11 | 1.3% |
| 302 - income tax - infrastructure | 1.1% |
| other (less than 1% each) | 12.9% |
| Total | 100.0% |
Software procedure:
Step-by-step software procedure to obtain bar chart for fund using Excel:
- In Excel sheet, enter Fund in one column and Percentage of total Expenditure in another column.
- Select the data, and then choose Insert > Insert Column Bar Charts.
- Select Clustered Column under More Column Charts.
Output using Excel is given below:
Interpretation:
- From the obtained table and bar chart, it can be observed that the fund category 050-General fund seems to be high, in terms of total expenditure percentage.
Want to see more full solutions like this?
Chapter 2 Solutions
Mindtapv2.0 For Anderson/sweeney/williams/camm/cochran's Modern Business Statistics With Microsoft Excel, 1 Term Printed Access Card (mindtap Course List)


- Cholesterol Cholesterol in human blood is necessary, but too much can lead to health problems. There are three main types of cholesterol: HDL (high-density lipoproteins), LDL (low-density lipoproteins), and VLDL (very low-density lipoproteins). HDL is considered “good” cholesterol; LDL and VLDL are considered “bad” cholesterol. A standard fasting cholesterol blood test measures total cholesterol, HDL cholesterol, and triglycerides. These numbers are used to estimate LDL and VLDL, which are difficult to measure directly. Your doctor recommends that your combined LDL/VLDL cholesterol level be less than 130 milligrams per deciliter, your HDL cholesterol level be at least 60 milligrams per deciliter, and your total cholesterol level be no more than 200 milligrams per deciliter. (a) Write a system of linear inequalities for the recommended cholesterol levels. Let x represent the HDL cholesterol level, and let y represent the combined LDL VLDL cholesterol level. (b) Graph the system of inequalities from part (a). Label any vertices of the solution region. (c) Is the following set of cholesterol levels within the recommendations? Explain. LDL/VLDL: 120 milligrams per deciliter HDL: 90 milligrams per deciliter Total: 210 milligrams per deciliter (d) Give an example of cholesterol levels in which the LDL/VLDL cholesterol level is too high but the HDL cholesterol level is acceptable. (e) Another recommendation is that the ratio of total cholesterol to HDL cholesterol be less than 4 (that is, less than 4 to 1). Identify a point in the solution region from part (b) that meets this recommendation, and explain why it meets the recommendation.arrow_forwardEditors plan, review, and revise content for publication. Although most editors work in offices, a growing number now work remotely from home. The work can be stressful because editors often have tight deadlines. Proficiency with computers and a bachelor's in communications, journalism, or English are typically required to become an editor. The median annual wage for editors was $54,890 in May, 2014. SOURCE: Bureau of Labor and Statistics, U.S. Department of Labor,Occupational Outlook Handbook, 2016 - 2017 Edition, Editors.Editors review story ideas and decide what material will appeal most to readers. Editors evaluate submissions from writers to decide what to publish. They also typically allocate space for the text, photos, and illustrations that make up a story. A local newspaper is planning a 4-part series of articles on gun control. The editor has received 19 submissions from his writers. He must decide which articles to publish and the sequence in which to publish them. How many…arrow_forwardCharity Navigator is America's leading independent charity evaluator. The following data show the total expenses ($), the percentage of the total budget spent on administrative expenses, the percentage spent on fundraising, and the percentage spent on program expenses for 10 supersized charities (Charity Navigator website). Administrative expenses include overhead, administrative staff and associated costs, and organizational meetings. Fundraising expenses are what a charity spends to raise money, and program expenses are what the charity spends on the programs and services it exists to deliver. The sum of the three percentages does not add to 100% because of rounding. Do not round your intermediate calculations. Total Administrative Fundraising Program Expenses Expenses Expenses Expenses Charity (millions of $) (%) (%) (%) 1 American Red Cross 3350 3.7 3.8 92.0 2 World Vision 1210 3.8 7.8 88.3 3 Smithsonian Institution 1080 23.8 2.3 73.8 4 Food For The Poor 1052 0.7 2.1 96.7 5…arrow_forward
- Charity Navigator is America's leading independent charity evaluator. The following data show the total expenses ($), the percentage of the total budget spent on administrative expenses, the percentage spent on fundraising, and the percentage spent on program expenses for 10 supersized charities (Charity Navigator website). Administrative expenses include overhead, administrative staff and associated costs, and organizational meetings. Fundraising expenses are what a charity spends to raise money, and program expenses are what the charity spends on the programs and services it exists to deliver. The sum of the three percentages does not add to 100% because of rounding. Do not round your intermediate calculations. Total Administrative Fundraising Program Expenses Expenses Expenses Expenses Charity (millions of $) (%) (%) (%) 1 American Red Cross 3352 3.9 3.9 92.3 2 World Vision 1205 4.1 7.5 88.3 3 Smithsonian Institution 1082 23.4 2.6 73.9 4 Food For The Poor 1048 0.5 2.3 96.9 5…arrow_forwardCharity Navigator is America's leading independent charity evaluator. The following data show the total expenses ($), the percentage of the total budget spent on administrative expenses, the percentage spent on fundraising, and the percentage spent on program expenses for 10 supersized charities (Charity Navigator website). Administrative expenses include overhead, administrative staff and associated costs, and organizational meetings. Fundraising expenses are what a charity spends to raise money, and program expenses are what the charity spends on the programs and services it exists to deliver. The sum of the three percentages does not add to 100% because of rounding. Do not round your intermediate calculations. Charity Total Administrative Fundraising Program Expenses Expenses Expenses Expenses (millions of $) (%) Fundraising Program 1 American Red Cross 3352 3.9 3.9 92.2 2 World Vision 1210 3.8 7.8 88.6 3 Smithsonian Institution 1082 23.5 2.6 73.6 4 Food For…arrow_forwardThe success of an airline depends heavily on its ability to provide a pleasant customer experience. One dimension of customer service on which airines compete is on-time arrival. The file LateFlights contains a sample of data from delayed fights showing the number of minutes each delayed fight was late for two dfferent airlines, Deita and Southwest. Click on the datafile logo to reference the data. DATA file Delta Southwest Delta Southwest Delta Southwest Delta Southwest Deita 36 30 34 38 119 120 63 37 35 67 114 53 102 55 8 87 68 100 43 50 86 74 17 66 87 35 40 34 64 41 53 30 86 33 57 61 7. 46 S2 26 70 62 75 54 80 a. Formulate the hypotheses that can be used to test for a difference between the population mean minutes late for delayed flights by these two airlines. 41= population mean minutes late for delayed Deita flights Ha = population mean minutes late for delayed Southwest flights Ho: H- 2Select your answer H.: -4a- Select your answer b. What is the sample mean number of minutes…arrow_forward
- The higher education department of Holmes Institute recorded data on the number of students enrolled in the different study majors for the years 2018 and 2019. Study major 2018 2019 Statistics 1700 2250 Business law 700 900 Accounting 1300 1450 Economics 750 1000 Finance 1450 1758 Marketing management 1069 1189 Auditing 360 351 Use an appropriate graphical technique or chart to compare the number of enrolment in 2018 and 2019 of the different study major. Display the chart. Use an appropriate graphical technique or chart to display the percentage value of the number of enrolment of the different study major in 2018 and 2019. Display the chart.arrow_forwardThe success of an airline depends heavily on its ability to provide a pleasant customer experience. One dimension of customer service on which airines compete is on-time arrival. The file LateFlights contains a sample of data from delayed fights showing the number of minutes each delayed fight was late for two different airlines, Deita and Southwest. Click on the datafile logo to reference the data. DATA file Delta Southwest Delta Southwest Delta Southwest Delta Southwest Delta 36 30 34 38 119 120 63 37 35 67 114 53 102 55 8 87 68 100 43 50 86 74 17 66 87 35 40 34 64 41 53 30 86 33 57 61 7. 46 52 26 70 62 75 54 80 a. Formulate the hypotheses that can be used to test for a difference between the population mean minutes late for delayed flights by these two airlines. H1= population mean minutes late for delayed Deita flights Ha= population mean minutes late for delayed Southwest flights Ho: H- 2 Select your answer H.: -a -Select your answer b. What is the sample mean number of minutes…arrow_forwardA company produces handmade shawls and afghans. They spin the yarn, dye it, and then weave it. A shawl requires 1 hour of spinning, 1 hour of dyeing, and 1 hour of weaving. An afghan requires 1 hour of spinning, 2 hours of dyeing, and 4 hours of weaving. There are at most 8 hours available each day for spinning, 10 hours for dyeing, and 16 hours for weaving. Summarize the data in a table. Use the table to write a system of inequalities. Then graph the feasible region. Complete the table. Hours Hours Number Spinning Dyeing Shawls x Afghans y Maximum Number of Hours Available 8 10 Hours Weaving 16arrow_forward
- Prices and mileage of 30 Subaru Forester models within 50 miles of Columbus, Indiana are collected from Cargarus.com. Mileage ranged from 7,442 to 77,674 miles. Prices ranged from $25,560 to $29,990. Attached file.arrow_forwardSpring is a peak time for selling houses. Suppose the data below contains the selling price, number of bathrooms, square footage, and number of bedrooms of 26 homes sold in Ft. Thomas, Kentucky, in spring 2018. Selling Price Baths Sq Ft Selling Price 160,000 170,000 178,000 182,500 195,100 212,500 245,900 250,000 255,000 258,000 267,000 268,000 275,000 1.5 1,786 2 1,768 1 1,219 1 1,578 1.5 1,125 2 1,196 2 2,128 N W 3 2 1,280 1,596 3.5 2,374 2.5 2,439 2 1,470 2 1,688 Beds 3 3 3 2 3 2 3 3 3 4 3 4 4 295,000 325,000 325,000 328,400 331,000 344,500 365,000 385,000 395,000 399,000 430,000 430,000 454,000 Baths Sq Ft 2.5 1,860 3 2,056 3.5 2,776 2 1,408 1.5 1,972 2.5 1,736 2.5 1,990 2.5 3,640 2.5 1,928 2 2,108 2 2,462 2 2,615 3.5 3,700 Beds 3 4 4 4 3 3 4 4 4 3 4 4 4 Consider the estimated regression equation we developed that can be used to predict the selling price given the number of bathrooms, square footage, and number of bedrooms in the house. (x, denotes number of bathrooms, x₂ denotes…arrow_forwardA corporation that operates five suppliers of athletic apparel in a region provides merchandise for a shoe company. The shoe company recently sought information from the five plants. One variable for which data were collected was the total money (in dollars) the company spent on medical support for its employees in the first three months of the year. Data on number of employees at the plants are also shown below. Complete parts a and b. Medical Employees $7,788 121 $14,371 409 $12,776 256 $6,874 107 $3,907 O 68 a. Compute the weighted mean medical payments for these five plants using the numbers of employees as the weights. The weighted mean is $. (Round to the nearest dollar as needed.)arrow_forward

 Glencoe Algebra 1, Student Edition, 9780079039897...AlgebraISBN:9780079039897Author:CarterPublisher:McGraw Hill