
Essentials of Statistics for Business and Economics (with XLSTAT Printed Access Card)
8th Edition
ISBN: 9781337114172
Author: David R. Anderson, Dennis J. Sweeney, Thomas A. Williams, Jeffrey D. Camm, James J. Cochran
Publisher: Cengage Learning
expand_more
expand_more
format_list_bulleted
Concept explainers
Videos
Textbook Question
Chapter 2, Problem 50SE
Education Level and Household Income. The U.S. Census Bureau serves as the leading source of quantitative data about the nation’s people and economy. The following crosstabulation shows the number of households (1000s) and the household income by the level of education for heads of household having received a high school degree or more education (U.S. Census Bureau website, https://www.census.gov/data/tables/time-series/demo/income-poverty/cps-hinc.html).
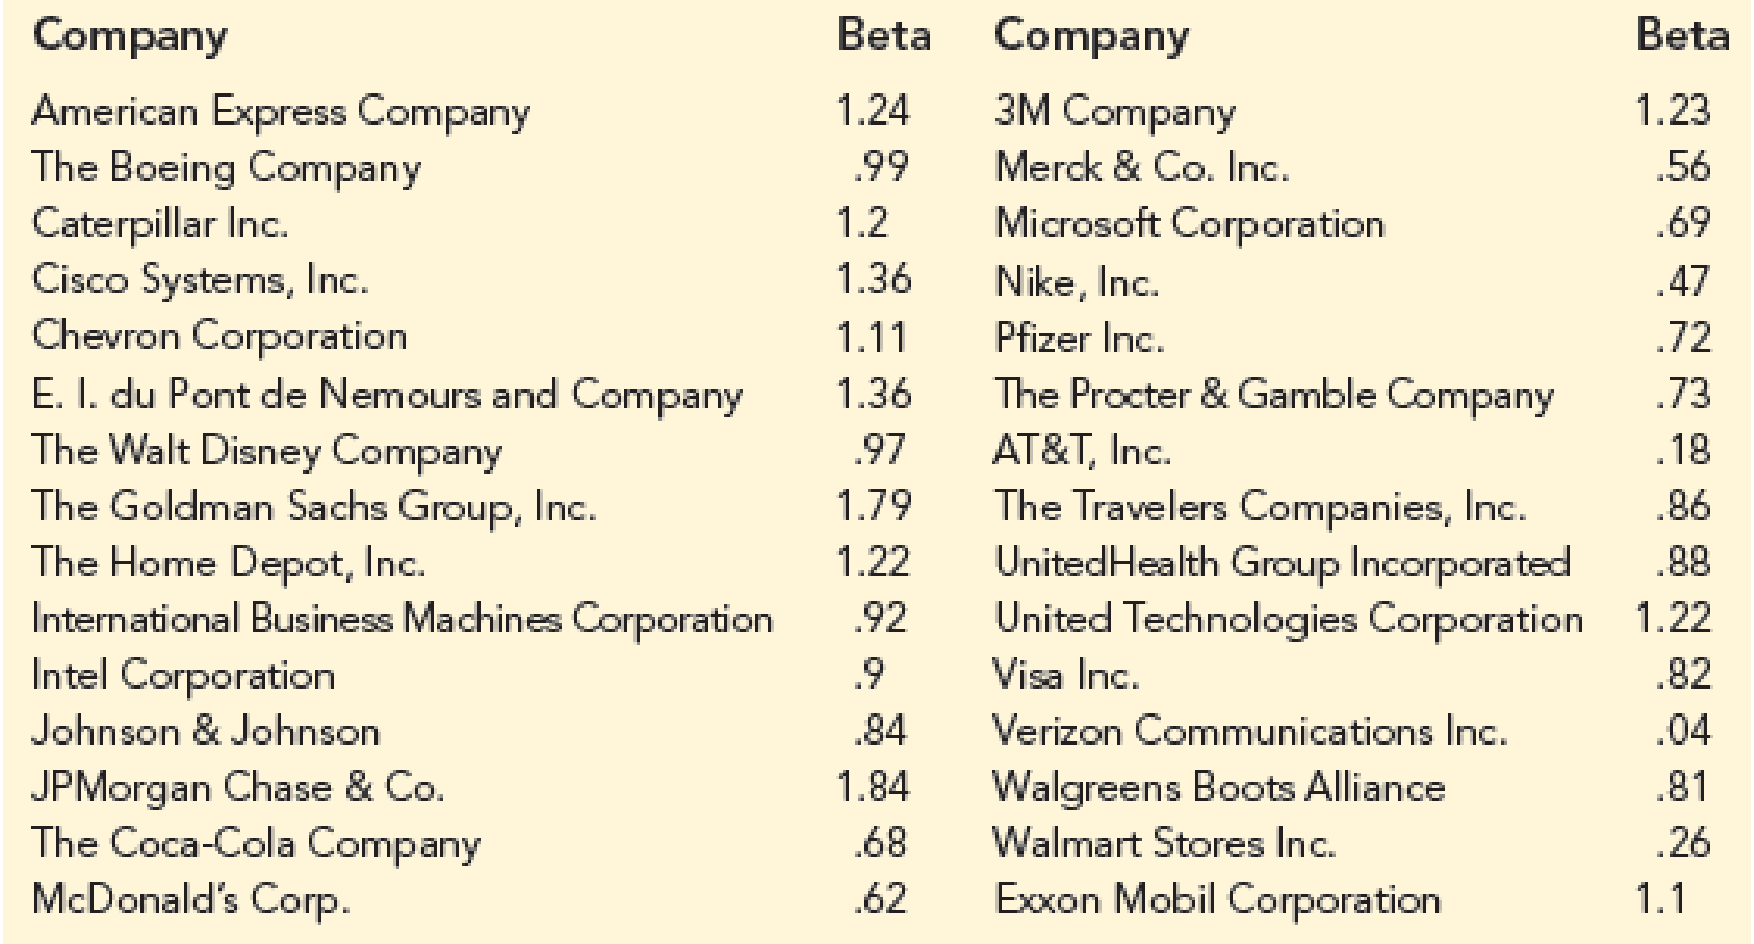
TABLE 2.17 Betas for Dow Jones Industrial Average Companies
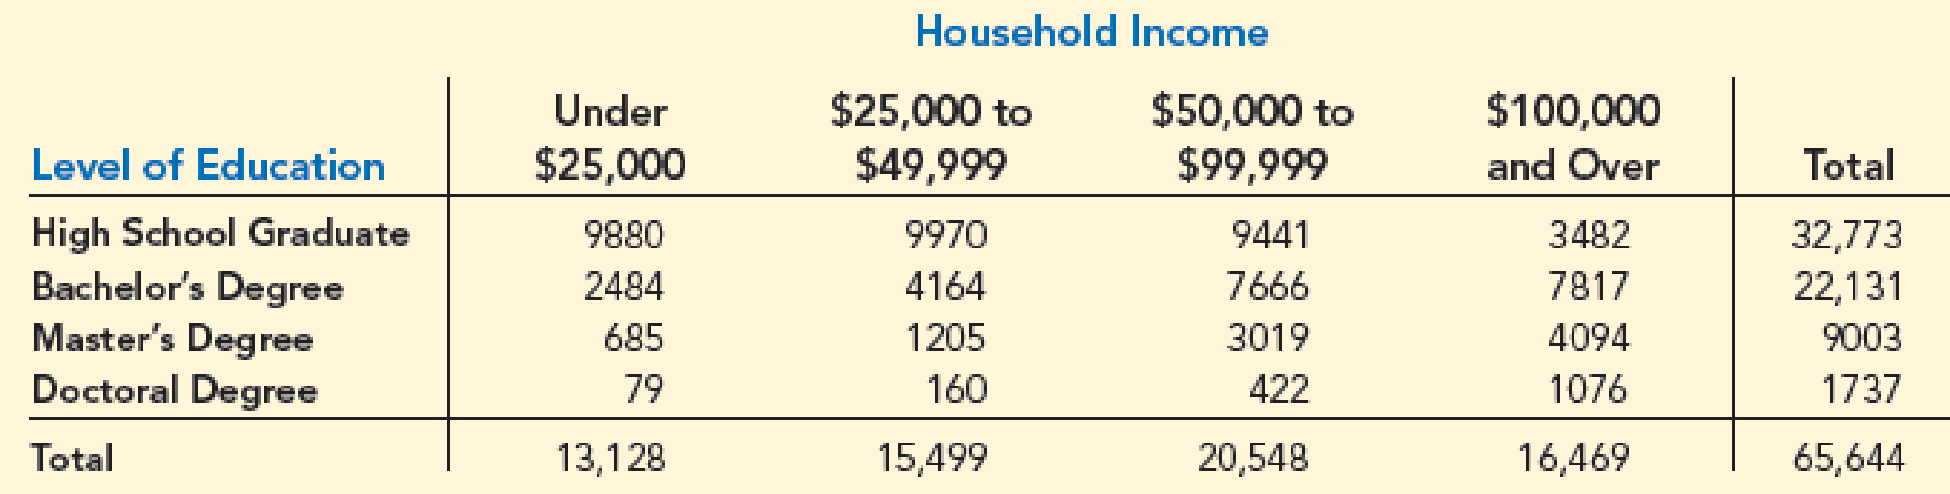
- a. Construct a percent frequency distribution for the level of education variable. What percentage of heads of households have a master’s or doctoral degree?
- b. Construct a percent frequency distribution for the household income variable. What percentage of households have an income of $50,000 or more?
- c. Convert the entries in the crosstabulation into column percentages. Compare the level of education of households with a household income of under $25,000 to the level of education of households with a household income of $100,000 or more. Comment on any other items of interest when reviewing the crosstabulation showing column percentages.
Expert Solution & Answer
Want to see the full answer?
Check out a sample textbook solution
Chapter 2 Solutions
Essentials of Statistics for Business and Economics (with XLSTAT Printed Access Card)
Ch. 2.1 - The response to a question has three alternatives:...Ch. 2.1 - A partial relative frequency distribution is...Ch. 2.1 - A questionnaire provides 58 Yes, 42 No, and 20...Ch. 2.1 - For the 20102011 viewing season, the top five...Ch. 2.1 - In alphabetical order, the six most common last...Ch. 2.1 - Nielsen Media Research provided the list of the 25...Ch. 2.1 - The Canmark Research Center Airport Customer...Ch. 2.1 - Data for a sample of 55 members of the Baseball...Ch. 2.1 - Prob. 9ECh. 2.1 - Online Hotel Ratings. TripAdvisor is one of many...
Ch. 2.2 - Consider the following data. a. Develop a...Ch. 2.2 - Consider the following frequency distribution....Ch. 2.2 - Construct a histogram for the data in exercise 12....Ch. 2.2 - Consider the following data. a. Construct a dot...Ch. 2.2 - Prob. 15ECh. 2.2 - Prob. 16ECh. 2.2 - A doctor’s office staff studied the waiting times...Ch. 2.2 - CBSSports.com developed the Total Player Ratings...Ch. 2.2 - Based on the tons handled in a year, the ports...Ch. 2.2 - CEO Time in Meetings. The London School of...Ch. 2.2 - Prob. 21ECh. 2.2 - Top U.S. Franchises. Entrepreneur magazine ranks...Ch. 2.2 - The DATAfile EngineeringSalary contains the median...Ch. 2.2 - Each year America.EDU ranks the best paying...Ch. 2.2 - Prob. 26ECh. 2.3 - The following data are for 30 observations...Ch. 2.3 - The following observations are for two...Ch. 2.3 - Daytona 500 Automobile Makes Average Speeds. The...Ch. 2.3 - Daytona 500 Average Speeds of Winners. The...Ch. 2.3 - Recently, management at Oak Tree Golf Course...Ch. 2.3 - Household Income Levels. The following...Ch. 2.3 - Values of World’s Most Valuable Brands. Each year...Ch. 2.3 - Revenue of World’s Most Valuable Brands. Refer to...Ch. 2.3 - Prob. 35ECh. 2.4 - The following 20 observations are for two...Ch. 2.4 - Consider the following data on two categorical...Ch. 2.4 - The following crosstabulation summarizes the data...Ch. 2.4 - Driving Speed and Fuel Efficiency. A study on...Ch. 2.4 - The Current Results website lists the average...Ch. 2.4 - Hypertension and Heart Disease. People often wait...Ch. 2.4 - Smartphone Ownership. Consider the following...Ch. 2.4 - Store Managers Time Study. The Northwest regional...Ch. 2 - SAT Scores. The SAT is a standardized test used by...Ch. 2 - Median Household Incomes. The file MedianHousehold...Ch. 2 - State Populations. Data showing the population by...Ch. 2 - A startup companys ability to gain funding is a...Ch. 2 - Complaints Reported to BBB. Consumer complaints...Ch. 2 - The term Beta refers to a measure of a stocks...Ch. 2 - Education Level and Household Income. The U.S....Ch. 2 - Western University has only one womens softball...Ch. 2 - Best Places to Work. Fortune magazine publishes an...Ch. 2 - Prob. 53SECh. 2 - Colleges’ Year Founded and Percent Graduated....Ch. 2 - Colleges’ Year Founded and Cost. Refer to the data...Ch. 2 - Colleges’ Cost and Percent Graduated. Refer to the...Ch. 2 - Google has changed its strategy with regard to how...Ch. 2 - Zoo Member Types and Attendance. A zoo has...Ch. 2 - Pelican Stores, a division of National Clothing,...Ch. 2 - The movie industry is a competitive business. More...Ch. 2 - Cincinnati, Ohio, also known as the Queen City,...
Knowledge Booster


Learn more about
Need a deep-dive on the concept behind this application? Look no further. Learn more about this topic, statistics and related others by exploring similar questions and additional content below.Recommended textbooks for you
 Linear Algebra: A Modern IntroductionAlgebraISBN:9781285463247Author:David PoolePublisher:Cengage Learning
 Big Ideas Math A Bridge To Success Algebra 1: Stu...AlgebraISBN:9781680331141Author:HOUGHTON MIFFLIN HARCOURTPublisher:Houghton Mifflin Harcourt
 Glencoe Algebra 1, Student Edition, 9780079039897...AlgebraISBN:9780079039897Author:CarterPublisher:McGraw Hill
Linear Algebra: A Modern Introduction
Algebra
ISBN:9781285463247
Author:David Poole
Publisher:Cengage Learning
Big Ideas Math A Bridge To Success Algebra 1: Stu...
Algebra
ISBN:9781680331141
Author:HOUGHTON MIFFLIN HARCOURT
Publisher:Houghton Mifflin Harcourt
Glencoe Algebra 1, Student Edition, 9780079039897...
Algebra
ISBN:9780079039897
Author:Carter
Publisher:McGraw Hill
Correlation Vs Regression: Difference Between them with definition & Comparison Chart; Author: Key Differences;https://www.youtube.com/watch?v=Ou2QGSJVd0U;License: Standard YouTube License, CC-BY
Correlation and Regression: Concepts with Illustrative examples; Author: LEARN & APPLY : Lean and Six Sigma;https://www.youtube.com/watch?v=xTpHD5WLuoA;License: Standard YouTube License, CC-BY