
Concept explainers
Videos
The bar graph shows the average age at which men in the United States married for the first time from 2009 through 2013. The data are displayed as five points in a
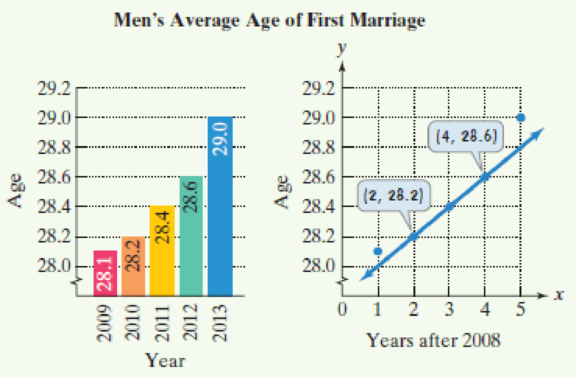
Source: U.S. Census Bureau
a. Use the two points whose coordinates are shown by the voice balloons to find the
b. Write the equation from part (a) in slope-intercept form. Use function notation.
c. If trends shown from 2009 through 2013 continue, use the linear function to project men’s average age of first marriage in 2020.
Want to see the full answer?
Check out a sample textbook solution
Chapter 2 Solutions
College Algebra Essentials, Books A La Carte Edition Plus MyLab Math with eText -- Access Card Package (5th Edition)


 Glencoe Algebra 1, Student Edition, 9780079039897...AlgebraISBN:9780079039897Author:CarterPublisher:McGraw Hill
 Holt Mcdougal Larson Pre-algebra: Student Edition...AlgebraISBN:9780547587776Author:HOLT MCDOUGALPublisher:HOLT MCDOUGAL
 Big Ideas Math A Bridge To Success Algebra 1: Stu...AlgebraISBN:9781680331141Author:HOUGHTON MIFFLIN HARCOURTPublisher:Houghton Mifflin Harcourt