Concept explainers
Videos
Case Study Crall and Whipple attached a fan to a cart placed on a level track and then released the cart. They made a position-versus-time graph (Fig. P2.54) and fit a curve to these data such that
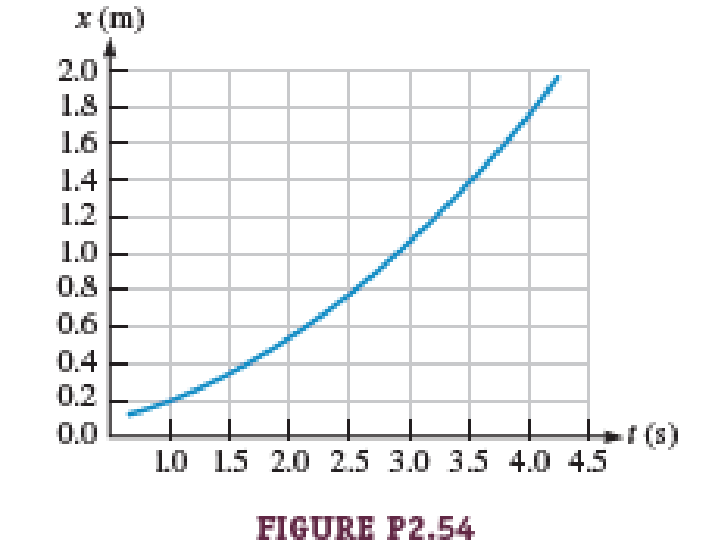
- a. Find and graph the velocity as a function of time.
- b. What is the shape of the velocity-versus-time graph? What do you expect the acceleration-versus-time graph to look like? Explain.
- c. Find and graph the acceleration as a function of time.

Trending nowThis is a popular solution!

Chapter 2 Solutions
Physics for Scientists and Engineers: Foundations and Connections


- An object is at x = 0 at t = 0 and moves along the x axis according to the velocitytime graph in Figure P2.40. (a) What is the objects acceleration between 0 and 4.0 s? (b) What is the objects acceleration between 4.0 s and 9.0 s? (c) What is the objects acceleration between 13.0 s and 18.0 s? (d) At what time(s) is the object moving with the lowest speed? (e) At what time is the object farthest from x = 0? (f) What is the final position x of the object at t = 18.0 s? (g) Through what total distance has the object moved between t = 0 and t = 18.0 s? Figure P2.40arrow_forwardA cyclist rides 8.0 km east for 20 minutes, then he turns and heads west for 8 minutes and 3.2 km. Finally, he rides east for 16 km, which takes 40 minutes. (a) What is the final displacement of the cyclist? (b) What is his average velocity?arrow_forwardAn object that moves in one dimension has the velocity-versus-time graph shown in Figure P2.52. At time t = 0, the object has position x = 0. a. At time t = 5 s. is the acceleration of the object positive, negative, or zero? Explain. b. At time t = 8 s, is the object speeding up, showing down, or moving with constant speed? Explain. c. Write an expression for the position of the object as a function of time. Explain how you use the graph to obtain your answer. d. Use your expression from part (c) to determine the time (if any) at which the object reaches its maximum position. Check your results by examining the graph. Hint: To get started with finding the maximum of a function, take the derivative and set it equal to zero.arrow_forward
- The froghopper Philaenus spumarius is supposedly the best jumper in the animal kingdom. To start a jump, this insect can accelerate at 4.00 km/s2 over a distance of 2.00 mm as it straightens its specially adapted jumping legs. Assume the acceleration is constant. (a) Find the upward velocity with which the insect takes off. (b) In what time interval does it reach this velocity? (c) How high would the insect jump if air resistance were negligible? The actual height it reaches is about 70 cm, so air resistance must be a noticeable force on the leaping froghopper.arrow_forwardA glider of length moves through a stationary photogate on an air track. A photogate (Fig. P2.44) is a device that measures the time interval td during which the glider blocks a beam of infrared light passing across the photogate. The ratio vd = /td is the average velocity of the glider over this part of its motion. Suppose the glider moves with constant acceleration. (a) Argue for or against the idea that vd is equal to the instantaneous velocity of the glider when it is halfway through the photogate in space. (b) Argue for or against the idea that vd is equal to the instantaneous velocity of the glider when it is halfway through the photogate in time.arrow_forwardA truck on a straight road starts from rest, accelerating at 2.00 m/s2 until it reaches a speed of 20.0 m/s. Then the truck travels for 20.0 s at constant speed until the brakes are applied, stopping the truck in a uniform manner in an additional 5.00 s. (a) How long is the truck in motion? (b) What is the average velocity of the truck for the motion described?arrow_forward
- Physics Review A hockey player strikes a puck, giving it an initial velocity of 10.0 m/s in the positive x-direction. The puck slows uniformly to 6.00 m/s when it has traveled 40.0 m. (a) What is the pucks acceleration? (b) At what velocity is it traveling after 2.00 s? (c) How long does it take to travel 40.0 m? (See Section 2.5.)arrow_forwardFigure P2.15 shows a graph of vx versus t for the motion of a motorcyclist as he starts from rest and moves along the road in a straight line. (a) Find the average acceleration for the time interval t = 0 to t = 6.00 s. (b) Estimate the time at which the acceleration has its greatest positive value and the value of the acceleration at that instant. (c) When is the acceleration zero? (d) Estimate the maximum negative value of the acceleration and the time at which it occurs. Figure P2.15arrow_forwardA person walks first at a constant speed of 5.00 m/s along a straight line from point to point and then back along the line from to at a constant speed of 3.00 m/s. (a) What is her average speed over the entire trip? (b) What is her average velocity over the entire trip?arrow_forward
- Car A and car B travel in the same direction along a straight section of the interstate highway. For the entire interval shown on the velocity-versus-time graph (Fig. P2.50), car A is ahead of car B. a. At time t3, is the magnitude of the acceleration of car A greater than, less than, or equal to that of car B? Explain. b. From time t1 to time t2, does the distance between cars A and B increase, decrease, or remain constant? Explain. FIGURE P2.50arrow_forwardA glider of length moves through a stationary photogate on an air track. A photogate (Fig. P2.19) is a device that measures the time interval td during which the glider blocks a beam of infrared light passing across the photogate. The ratio vd = /td is the average velocity of the glider over this part of its motion. Suppose the glider moves with constant acceleration. (a) Argue for or against the idea that vd is equal to the instantaneous velocity of the glider when it is halfway through the photogate in space. (b) Argue for or against the idea that vd is equal to the instantaneous velocity of the glider when it is halfway through the photogate in time. Figure P2.19arrow_forwardThe Acela is an electric train on the WashingtonNew YorkBoston run, carrying passengers at 170 mi/h. A velocitytime graph for the Acela is shown in Figure P2.46. (a) Describe the trains motion in each successive time interval. (b) Find the trains peak positive acceleration in the motion graphed. (c) Find the trains displacement in miles between t = 0 and t = 200 s. Figure P2.46 Velocity versus time graph for the Acela.arrow_forward
 Physics for Scientists and Engineers with Modern ...PhysicsISBN:9781337553292Author:Raymond A. Serway, John W. JewettPublisher:Cengage Learning
 Physics for Scientists and EngineersPhysicsISBN:9781337553278Author:Raymond A. Serway, John W. JewettPublisher:Cengage Learning
 Glencoe Physics: Principles and Problems, Student...PhysicsISBN:9780078807213Author:Paul W. ZitzewitzPublisher:Glencoe/McGraw-Hill
 College PhysicsPhysicsISBN:9781285737027Author:Raymond A. Serway, Chris VuillePublisher:Cengage Learning
 Physics for Scientists and Engineers, Technology ...PhysicsISBN:9781305116399Author:Raymond A. Serway, John W. JewettPublisher:Cengage Learning
 Physics for Scientists and Engineers: Foundations...PhysicsISBN:9781133939146Author:Katz, Debora M.Publisher:Cengage Learning