
Basic Business Statistics, Student Value Edition (13th Edition)
13th Edition
ISBN: 9780321946393
Author: Mark L. Berenson, David M. Levine, Kathryn A. Szabat
Publisher: PEARSON
expand_more
expand_more
format_list_bulleted
Videos
Textbook Question
Chapter 2, Problem 54PS
How have stocks performed in the past? The following table presents the data stored in Stock Performance of a brand measure of stocks (by percentage) for each decade from the 1830s through the 2000s:
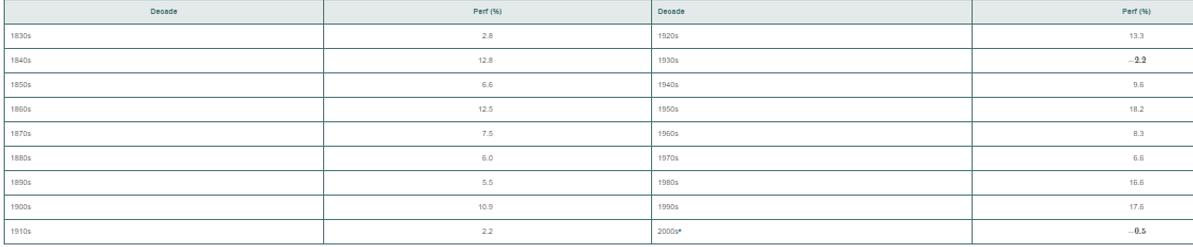
“Through December 15, 2009.
a. Construct a time-series plot of the stock performance from the 1830s to the 2000s.
b. Does there appear to be any pattern in the data?
Expert Solution & Answer
Want to see the full answer?
Check out a sample textbook solution
Students have asked these similar questions
After its move in 1990 to La Junta, Colorado, and its new initiatives, the DeBourgh Manufacturing Company began an upward climb of record sales. Suppose the figures shown here are the DeBourgh monthly sales figures from January 2001 through December 2009 (in $1,000s).
a) Produce a time series plot. Are there any trends evident in the data? Does DeBourgh have a seasonal component to its sales?
b) Deseasonalize the data using Multiplicative model with a 0.5 weighted moving average. Produce a time series plot of the deseasonalized data and add a trendline.
c) Forecast the sales from January to December of the year 2010.
d) Include a discussion of the general direction of sales and any seasonal tendencies that might be occurrinG
Month
2001
2002
2003
2004
2005
2006
2007
2008
2009
January
139.7
165.1
177.8
228.6
266.7
431.8
381
431.8
495.3
February
114.3
177.8
203.2
254
317.5
457.2
406.4
444.5
533.4
March
101.6
177.8
228.6
266.7
368.3
457.2
431.8
495.3
635
April
152.4
203.2…
the values of alabama building contracts (in $ millions) for a 12-month period follow.240 350 230 260 280 320 220 310 240 310 240 230a. construct a time series plot. What type of pattern exists in the data?
Which of the following time series forecasting methods would not be used to forecast seasonal data?
Chapter 2 Solutions
Basic Business Statistics, Student Value Edition (13th Edition)
Ch. 2 - A categorical variable has three categories, with...Ch. 2 - The following data represent the responses to two...Ch. 2 - The following table, stored in smartphone sales,...Ch. 2 - The Edmunds.com NHTSA Complaints Activity Report...Ch. 2 - The 2013 Mortimer Spinks and Computer Weekly...Ch. 2 - The following table represents world oil...Ch. 2 - Visier’s Survey of Employers explores how North...Ch. 2 - A survey of 1,085 adults asked “Do you enjoy...Ch. 2 - Prob. 9PSCh. 2 - Do special recommendations increase ad...
Ch. 2 - Construct an ordered array, given the following...Ch. 2 - Construct an ordered array, given the following...Ch. 2 - Prob. 13PSCh. 2 - Prob. 14PSCh. 2 - Prob. 15PSCh. 2 - The file Utility contains the following data about...Ch. 2 - How much time do commuters living in or near...Ch. 2 - How do the average credit scores of people living...Ch. 2 - One operation of a mill is to cut pieces of steel...Ch. 2 - Prob. 20PSCh. 2 - Prob. 21PSCh. 2 - Prob. 22PSCh. 2 - The file Drink Contains the following data for the...Ch. 2 - Prob. 24PSCh. 2 - Prob. 25PSCh. 2 - Prob. 26PSCh. 2 - Prob. 27PSCh. 2 - Prob. 28PSCh. 2 - Prob. 29PSCh. 2 - Prob. 30PSCh. 2 - Prob. 31PSCh. 2 - Do special recommendations increase ad...Ch. 2 - Construct a stern-and-leaf display, given the...Ch. 2 - Construct an ordered array, given the following...Ch. 2 - The following is a stern-and0-leaf display...Ch. 2 - Prob. 36PSCh. 2 - The file MobileSpeed contains the overall download...Ch. 2 - The file Utility contains the following data about...Ch. 2 - Prob. 39PSCh. 2 - Prob. 40PSCh. 2 - How much time do Americans living in or near...Ch. 2 - How do the average credit scores of people living...Ch. 2 - One operation of a mill is to cut pieces of steel...Ch. 2 - Prob. 44PSCh. 2 - Prob. 45PSCh. 2 - Prob. 46PSCh. 2 - The data stored in Drink represents the amount of...Ch. 2 - The following is a set of data from a sample of...Ch. 2 - Prob. 49PSCh. 2 - Movie companies need to predict the gross receipts...Ch. 2 - Data were collected on the typical cost of dining...Ch. 2 - Prob. 52PSCh. 2 - Prob. 53PSCh. 2 - How have stocks performed in the past? The...Ch. 2 - Prob. 55PSCh. 2 - Prob. 56PSCh. 2 - The file Audits contains the number of audits of...Ch. 2 - Prob. 58PSCh. 2 - Prob. 59PSCh. 2 - Prob. 60PSCh. 2 - Using the sample of retirement funds stored in...Ch. 2 - Prob. 65PSCh. 2 - Prob. 66PSCh. 2 - Examine the following visualization, adapted from...Ch. 2 - Prob. 69PSCh. 2 - Prob. 70PSCh. 2 - How do histograms and polygons differ in...Ch. 2 - Why would you construct a summary table?Ch. 2 - What are the advantages and disadvantage of using...Ch. 2 - Compare and contrast the bar chart for categorical...Ch. 2 - What is the difference between a time-series plot...Ch. 2 - Why is it said that the main feature of a Pareto...Ch. 2 - What are the three different ways to break down...Ch. 2 - How can a multidimensional table differ from a...Ch. 2 - What type of insights can you gain from a...Ch. 2 - The following summary, table, presents the...Ch. 2 - The following table represents the market share...Ch. 2 - Prob. 82PSCh. 2 - The owner of a restaurant that services...Ch. 2 - Prob. 84PSCh. 2 - The following data represents the pounds per...Ch. 2 - Prob. 86PSCh. 2 - One of the major measures of the quality of...Ch. 2 - Prob. 88PSCh. 2 - Prob. 89PSCh. 2 - Prob. 90PSCh. 2 - Prob. 91PSCh. 2 - Prob. 92PSCh. 2 - What was the average price of a room at two-star,...Ch. 2 - The file Protein contains calorie and cholesterol...Ch. 2 - The file Natural Gas contains the U.S. monthly...Ch. 2 - Prob. 96PSCh. 2 - Prob. 97PSCh. 2 - A/B testing allows business to test a new design...
Knowledge Booster


Learn more about
Need a deep-dive on the concept behind this application? Look no further. Learn more about this topic, statistics and related others by exploring similar questions and additional content below.Similar questions
- Table 6 shows the year and the number ofpeople unemployed in a particular city for several years. Determine whether the trend appears linear. If so, and assuming the trend continues, in what year will the number of unemployed reach 5 people?arrow_forwardThe table below contains the average price paid for a new home in a certain area from 2000 to 2010. a. Construct a time-series plot of new home prices. b. What pattern, if any, is present in the data? Year Average_Price_($_thousands)2000 351.12001 330.52002 310.52003 296.72004 229.72005 182.32006 154.52007 156.32008 154.72009 154.52010 154.5arrow_forwardUsing the time series data in the table, respond to the following items. Period Sales 1 $ 615 2 678 3 761 4 710 5 784 6 801 7 852 8 698 9 1,193 10 1,115 11 1,231 12 1,259 13 1,495 14 1,229 15 1,652 16 1,337 17 1,673 18 1,613 d-1. Compute all possible forecasts using a trend forecasting model using simple linear regression? (Round your answers to 3 decimal places.) Period Sales Predicted Sales Absolute Error 1 615 2 678 3 761 4 710 5 784 6 801 7 852 8 698 9 1,193 10 1,115 11 1,231 12 1,259 13 1,495 14 1,229 15 1,652 16 1,337 17 1,673 18 1,613 d-2. What is the MAD? (Round your answer to 3 decimal places.) d-3. What is the trend equation based on the regression analysis? (Round your answers to 3 decimal places.) Sales = __________ + _______________ time…arrow_forward
- The following data set provides the total number of shipments of core major household appliances in the U.S. from 2000 to 2016 (in millions): Year Shipments (millions) 2000 38.4 2001 38.2 2002 40.8 2003 42.5 2004 46.1 2005 47.0 2006 46.7 2007 44.1 2008 39.8 2009 36.5 2010 38.2 2011 36.0 2012 35.8 2013 39.2 2014 41.5 2015 42.9 2016 44.7 a. Plot the time series. b. Fit a three-year moving average to the data and plot the results. c. Fit a five-year moving average to the data and plot the results. d. Compute a linear trend forecasting equation and plot the trend line. e. Compute a quadratic trend forecasting equation and plot the results.arrow_forwardThe folloiwing table shows data for U.S. movie theater admissions (per week). Display the data as a time-series graph and write a short paragraph explaining any noticeable trends or patterns. Year Admissions Year Admissions 1945 79.0 1985 20.30 1955 39.9 1995 23.3 1965 19.8 2005 26.5 1975 19.9 2015 25.4arrow_forwardthe table shows the percent of households with internet access for selected years from 2009 and projected through 2015. Year Percent of households 2009 67 2010 70 2011 72.5 2012 75 2013 76.5 2014 77.2 2015 78 Use the model to predict the percent of households with internet access in 2022.arrow_forward
- For the hawkins company, the monthly percentages of all shipments received on timeover the past 12 months are 80, 82, 84, 83, 83, 84, 85, 84, 82, 83, 84, and 83.a. construct a time series plot. What type of pattern exists in the data?arrow_forwardThe following table shows a company's annual revenue (in billions of dollars) for 2009 to 2014. Year Period (t) Revenue 2009 1 23.8 2010 2 29.2 2011 3 37.8 2012 4 50.1 2013 5 59.9 2014 6 66.8 -Develop a linear trend equation for this time series to forecast revenue (in billions of dollars). (Round your numerical values to three decimal places.) -What is the average revenue increase per year (in billions of dollars) that this company has been realizing? (Round your answer to three decimal places.) -Compute an estimate of this company's revenue (in billions of dollars) for 2015. (Round your answer to two decimal places.)arrow_forwardUse quantitativeforecast methods for the data shown below Period Observation 1 24 2 34 3 36 4 37 5 41 6 44 7 45 Plot the original time series and comment on appropriateness of a linear trend.arrow_forward
- Using excel. For the Hawkins Company, the monthly percentages of all shipments received on time over the past 12 months are 80, 82, 84, 83, 83, 84, 85, 84, 82, 83, 84, and 83. a. Construct a time series plot. What type of pattern exists in the data? b. Compare the three-month moving average approach with the exponential smoothing approach for α=\alpha =α= .2. Which provides more accurate forecasts using MSE as the measure of forecast accuracy? c. What is the forecast for next month?arrow_forward#4) Commuter ridership in Athens, Greece, during the summer months is believed to be heavily tied to the number of tourists visiting the city. During the past 12 years, the data are given in the following table. Year Number of Tourists (millions) Ridership (hundreds of thousands) 1 6 11 2 11 16 3 8 16 4 10 14 5 19 28 6 18 26 7 16 21 8 20 25 9 24 45 10 18 28 11 11 18 12 19 35 a) Create a time series plot for the ridership. b) Using linear regression to see if using the year is a good predictor for the ridership. What is the regression equation? How accurate is the model? c) Using linear regression to see if using the number of tourists is a good predictor for the ridership. What is the regression equation? How accurate is the model? d) Which linear regression equation is better? What is the expected ridership if 10 million tourists visit the city next year? e) Excel Filearrow_forwardconsider the following time series data.t 1 2 3 4 5 6 7yt10 9 7 8 6 4 4a. construct a time series plot. What type of pattern exists in the data?b. develop the linear trend equation for this time series.c. What is the forecast for t = 8?arrow_forward
arrow_back_ios
SEE MORE QUESTIONS
arrow_forward_ios
Recommended textbooks for you

Time Series Analysis Theory & Uni-variate Forecasting Techniques; Author: Analytics University;https://www.youtube.com/watch?v=_X5q9FYLGxM;License: Standard YouTube License, CC-BY
Operations management 101: Time-series, forecasting introduction; Author: Brandoz Foltz;https://www.youtube.com/watch?v=EaqZP36ool8;License: Standard YouTube License, CC-BY