
MindTap Business Statistics, 1 term (6 months) Printed Access Card for Anderson/Sweeney/Williams/Camm/Cochran's Essentials of Statistics for Business and Economics, 8th
8th Edition
ISBN: 9781337114288
Author: Anderson, David R.; Sweeney, Dennis J.; Williams, Thomas A.; Camm, Jeffrey D.; Cochran, James J.
Publisher: Cengage Learning
expand_more
expand_more
format_list_bulleted
Concept explainers
Videos
Textbook Question
Chapter 2, Problem 54SE
Colleges’ Year Founded and Percent Graduated. Refer to the data set in Table 2.18.
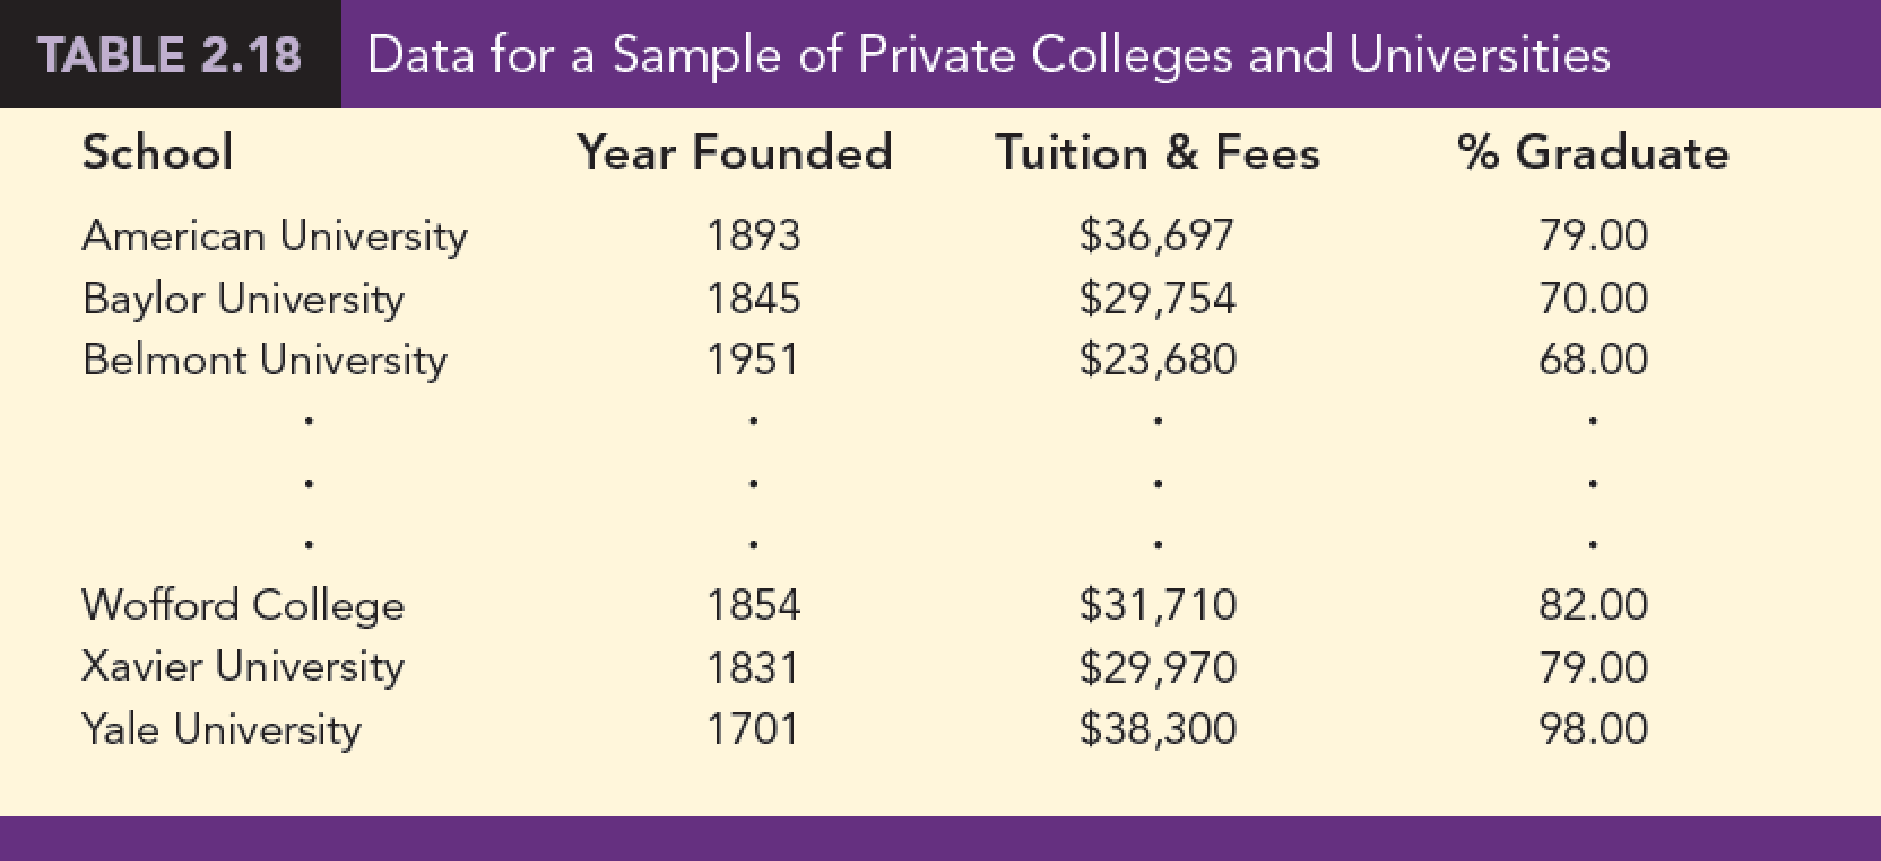
- a. Construct a crosstabulation with Year Founded as the row variable and % Graduate as the column variable. Use classes starling with 1600 and ending with 2000 in increments of 50 for Year Founded. For % Graduate, use classes starling with 35% and ending with 100% in increments of 5%.
- b. Compute the row percentages for your crosstabulation in part (a).
- c. Comment on any relationship between the variables.
Expert Solution & Answer

Trending nowThis is a popular solution!

Students have asked these similar questions
The table below shows the number of state-registered automatic weapons and the murder rate for several Northwestern states.
xx11.68.46.73.52.72.62.30.7yy1410.99.976.26.35.74.3
xx = thousands of automatic weaponsyy = murders per 100,000 residents
This data can be modeled by the equation y=0.87x+3.83.y=0.87x+3.83. Use this equation to answer the following;A) How many murders per 100,000 residents can be expected in a state with 8.6 thousand automatic weapons?Answer = Round to 3 decimal places.B) How many murders per 100,000 residents can be expected in a state with 6.6 thousand automatic weapons?Answer = Round to 3 decimal places.
The following table shows retail sales in drug stores in billions of dollars in the U.S. for years since 1995.
Year
Retail Sales
0
85.851
3
108.426
6
141.781
9
169.256
12
202.297
15
222.266
Let � be the retails sales in billions of dollars in � years since 1995. A linear model for the data is �=9.44�+84.182.36912158090100110120130140150160170180190200210220A) Use the above scatter plot to decide whether the line of best fit, fits the data well.
The function is a good model for the data.
The function is not a good model for the data
B) To the nearest billion, estimate the retails sales in the U. S. in 2017. billions of dollars.C) Use the equation to find the year in which retails sales will be $231 billion.
The following table shows retail sales in drug stores in billions of dollars in the U.S. for years since 1995.
Year
Retail Sales
0
85.851
3
108.426
6
141.781
9
169.256
12
202.297
15
222.266
Let yy be the retails sales in billions of dollars in xx years since 1995. A linear model for the data is y=9.44x+84.182y=9.44x+84.182.
B) To the nearest billion, estimate the retails sales in the U. S. in 2013
Use the equation to find the year in which retails sales will be $245 billion.
Chapter 2 Solutions
MindTap Business Statistics, 1 term (6 months) Printed Access Card for Anderson/Sweeney/Williams/Camm/Cochran's Essentials of Statistics for Business and Economics, 8th
Ch. 2.1 - The response to a question has three alternatives:...Ch. 2.1 - A partial relative frequency distribution is...Ch. 2.1 - A questionnaire provides 58 Yes, 42 No, and 20...Ch. 2.1 - For the 20102011 viewing season, the top five...Ch. 2.1 - In alphabetical order, the six most common last...Ch. 2.1 - Nielsen Media Research provided the list of the 25...Ch. 2.1 - The Canmark Research Center Airport Customer...Ch. 2.1 - Data for a sample of 55 members of the Baseball...Ch. 2.1 - Prob. 9ECh. 2.1 - Online Hotel Ratings. TripAdvisor is one of many...
Ch. 2.2 - Consider the following data. a. Develop a...Ch. 2.2 - Consider the following frequency distribution....Ch. 2.2 - Construct a histogram for the data in exercise 12....Ch. 2.2 - Consider the following data. a. Construct a dot...Ch. 2.2 - Prob. 15ECh. 2.2 - Prob. 16ECh. 2.2 - A doctor’s office staff studied the waiting times...Ch. 2.2 - CBSSports.com developed the Total Player Ratings...Ch. 2.2 - Based on the tons handled in a year, the ports...Ch. 2.2 - CEO Time in Meetings. The London School of...Ch. 2.2 - Prob. 21ECh. 2.2 - Top U.S. Franchises. Entrepreneur magazine ranks...Ch. 2.2 - The DATAfile EngineeringSalary contains the median...Ch. 2.2 - Each year America.EDU ranks the best paying...Ch. 2.2 - Prob. 26ECh. 2.3 - The following data are for 30 observations...Ch. 2.3 - The following observations are for two...Ch. 2.3 - Daytona 500 Automobile Makes Average Speeds. The...Ch. 2.3 - Daytona 500 Average Speeds of Winners. The...Ch. 2.3 - Recently, management at Oak Tree Golf Course...Ch. 2.3 - Household Income Levels. The following...Ch. 2.3 - Values of World’s Most Valuable Brands. Each year...Ch. 2.3 - Revenue of World’s Most Valuable Brands. Refer to...Ch. 2.3 - Prob. 35ECh. 2.4 - The following 20 observations are for two...Ch. 2.4 - Consider the following data on two categorical...Ch. 2.4 - The following crosstabulation summarizes the data...Ch. 2.4 - Driving Speed and Fuel Efficiency. A study on...Ch. 2.4 - The Current Results website lists the average...Ch. 2.4 - Hypertension and Heart Disease. People often wait...Ch. 2.4 - Smartphone Ownership. Consider the following...Ch. 2.4 - Store Managers Time Study. The Northwest regional...Ch. 2 - SAT Scores. The SAT is a standardized test used by...Ch. 2 - Median Household Incomes. The file MedianHousehold...Ch. 2 - State Populations. Data showing the population by...Ch. 2 - A startup companys ability to gain funding is a...Ch. 2 - Complaints Reported to BBB. Consumer complaints...Ch. 2 - The term Beta refers to a measure of a stocks...Ch. 2 - Education Level and Household Income. The U.S....Ch. 2 - Western University has only one womens softball...Ch. 2 - Best Places to Work. Fortune magazine publishes an...Ch. 2 - Prob. 53SECh. 2 - Colleges’ Year Founded and Percent Graduated....Ch. 2 - Colleges’ Year Founded and Cost. Refer to the data...Ch. 2 - Colleges’ Cost and Percent Graduated. Refer to the...Ch. 2 - Google has changed its strategy with regard to how...Ch. 2 - Zoo Member Types and Attendance. A zoo has...Ch. 2 - Pelican Stores, a division of National Clothing,...Ch. 2 - The movie industry is a competitive business. More...Ch. 2 - Cincinnati, Ohio, also known as the Queen City,...
Knowledge Booster


Learn more about
Need a deep-dive on the concept behind this application? Look no further. Learn more about this topic, statistics and related others by exploring similar questions and additional content below.Similar questions
- The following observations are for two quantitative variables, x and y. Observation x y 1 28 72 2 17 99 3 52 58 4 79 34 5 37 60 6 71 22 7 37 77 8 27 85 9 64 45 10 53 47 Observation x y 11 13 98 12 84 21 13 59 32 14 17 81 15 70 34 16 47 64 17 35 68 18 62 67 19 30 39 20 43 28 (a) Develop a crosstabulation for the data, with x as the row variable and y as the column variable. For x use classes of 10–29, 30–49, and so on; for y use classes of 40–59, 60–79, and so on. y GrandTotal 20–39 40–59 60–79 80–99 x 10–29 30–49 50–69 70–90 Grand Total (b) Compute the row percentages. (Round your answers to one decimal place.) y GrandTotal 20–39 40–59 60–79 80–99 x 10–29 30–49 50–69 70–90 (c) Compute the column percentages. (Round your answers to one decimal place.) y 20–39 40–59 60–79 80–99 x…arrow_forwardThe table below shows the number of state-registered automatic weapons and the murder rate for several Northwestern states. xx 11.8 8.4 7.2 3.6 2.7 2.7 2.2 0.7 yy 13.8 11.5 10 7.2 6.4 6.1 6.2 4.4 xx = thousands of automatic weaponsyy = murders per 100,000 residents This data can be modeled by the equation y=0.84x+4.06.y=0.84x+4.06. Use this equation to answer the following;A) How many murders per 100,000 residents can be expected in a state with 2.7 thousand automatic weapons?Answer = Round to 3 decimal places.B) How many murders per 100,000 residents can be expected in a state with 4.9 thousand automatic weapons?Answer = Round to 3 decimal places.arrow_forwardThe following table shows retail sales in drug stores in billions of dollars in the U.S. for years since 1995. Year Retail Sales 0 85.851 3 108.426 6 141.781 9 169.256 12 202.297 15 222.266 Let yy be the retails sales in billions of dollars in xx years since 1995. A linear model for the data is y=9.44x+84.182y=9.44x+84.182.To the nearest billion, estimate the retails sales in the U. S. in 2012. _______billions of dollars. Use the equation to find the year in which retails sales will be $246 billion. _________arrow_forward
- A psychologist read the results of the study and wanted to replicate the methodology in her school. The data are below. Number in class Number of incidents 10 120 18 090 20 118 19 060 20 081 12 064 15 026 14 038 12 050 11 080 15 100 11 124 12.) The linear equation for the above data is a) Ŷ =84.478X + (-.354) b) Ŷ =-.354X + 84.478 c) Ŷ = -.040X + 84.478 d) Ŷ =1.997X + (-.354) How many incidents would be expected if there were 17 people in the class ?_________________ What is the coefficent of determination?arrow_forwardDuring a particularly dry growing season in a southern state, farmers noticed that there is a delicate balance between the number of seeds that are planted per square foot and the yield of the crop in pounds per square foot. The yields were the smallest when the number of seeds per square foot was either very small or very large. The data in the table show various numbers of seeds planted per square foot and yields (in pounds per square foot) for a sample of fields. A 2-column table with 15 rows. Column 1 is labeled number of seeds (per square foot) with entries 28, 75, 30, 43, 71, 35, 40, 59, 66, 79, 85, 81, 16, 33, 16. Column 2 is labeled yield (pounds per square foot) with entries 131, 171, 132, 166, 169, 150, 161, 183, 173, 161, 147, 157, 86, 145, 86. Which scatterplot represents the seed and yield data? A graph titled number of Seeds and Crop Yield has seeds (per square foot) on the x-axis, and yard (pounds per square foot) on the y-axis. The points curve up to a point, and…arrow_forwardThe percentage of employees who cease their employment during a year is referred to as employee turnover, and it is a serious issue for businesses. The following table shows the cost, in millions of dollars, to a certain company for a given employee turnover percentage in a year. E = employee turnover 10 20 30 40 C = cost 250 390 530 670 Find a linear model for the data. C(E) =arrow_forward
- The following table shows retail sales in drug stores in billions of dollars in the U.S. for years since 1995. Year Retail Sales 0 85.851 3 108.426 6 141.781 9 169.256 12 202.297 15 222.266 Let yy be the retails sales in billions of dollars in xx years since 1995. A linear model for the data is y=9.44x+84.182y=9.44x+84.182.36912158090100110120130140150160170180190200210220A) Use the above scatter plot to decide whether the line of best fit, fits the data well. The function is a good model for the data. The function is not a good model for the data B) To the nearest billion, estimate the retails sales in the U. S. in 2017. billions of dollars.C) Use the equation to find the year in which retails sales will be $246 billion.arrow_forwardConsider the data in the Excel file Nuclear Power. Use simple linear regression to forecast the data. What would be the forecasts for the next three years? Nuclear Electric Power Production (Billion KWH) Year US Canada France 1980 251.12 35.88 63.42 1981 272.67 37.8 99.24 1982 282.77 36.17 102.6 1983 293.68 46.22 136 1984 327.63 49.26 180.5 1985 383.69 57.1 211.2 1986 414.04 67.23 239.6 1987 455.27 72.89 249.3 1988 526.97 78.18 260.3 1989 529.35 75.35 288.7 1990 576.86 69.24 298.4 1991 612.57 80.68 314.8 1992 618.78 76.55 321.5 1993 610.29 90.08 349.8 1994 640.44 102.4 342 1995 673.4 92.95 358.4 1996 674.73 88.13 377.5 1997 628.64 77.86 375.7 1998 673.7 67.74 368.6 1999 728.25 69.82 374.5 2000 753.89 69.16 394.4 2001 768.83 72.86 400 2002 780.06 71.75 414.9 2003 763.73 71.15 419 2004 788.53 85.87 425.8 2005 781.99 87.44 429 2006 787.22 93.07 427.7arrow_forwardA candy bar manufacturer is interested in trying to estimate how sales are influenced by the price of their product. To do this, the company randomly chooses 6 small cities and offers the candy bar at different prices. Using candy bar sales as the dependent variable, the company will conduct a simple linear regression on the data below: City Price ($) Sales River City 1.30 100 Hudson 1.60 90 Ellsworth 1.80 60 Prescott 2.00 40 Rock Elm 2.40 38 Stillwater 2.90 32 What is the estimated mean change in the sales of the candy bar if price goes up by $1.00? Question 3 options: A) -48.193 B) 0.784 C) -44.58 D) 161.386arrow_forward
arrow_back_ios
arrow_forward_ios
Recommended textbooks for you
 Linear Algebra: A Modern IntroductionAlgebraISBN:9781285463247Author:David PoolePublisher:Cengage Learning
 Glencoe Algebra 1, Student Edition, 9780079039897...AlgebraISBN:9780079039897Author:CarterPublisher:McGraw Hill
 Holt Mcdougal Larson Pre-algebra: Student Edition...AlgebraISBN:9780547587776Author:HOLT MCDOUGALPublisher:HOLT MCDOUGAL
 Functions and Change: A Modeling Approach to Coll...AlgebraISBN:9781337111348Author:Bruce Crauder, Benny Evans, Alan NoellPublisher:Cengage Learning
Linear Algebra: A Modern Introduction
Algebra
ISBN:9781285463247
Author:David Poole
Publisher:Cengage Learning
Glencoe Algebra 1, Student Edition, 9780079039897...
Algebra
ISBN:9780079039897
Author:Carter
Publisher:McGraw Hill
Holt Mcdougal Larson Pre-algebra: Student Edition...
Algebra
ISBN:9780547587776
Author:HOLT MCDOUGAL
Publisher:HOLT MCDOUGAL
Functions and Change: A Modeling Approach to Coll...
Algebra
ISBN:9781337111348
Author:Bruce Crauder, Benny Evans, Alan Noell
Publisher:Cengage Learning
Statistics 4.1 Point Estimators; Author: Dr. Jack L. Jackson II;https://www.youtube.com/watch?v=2MrI0J8XCEE;License: Standard YouTube License, CC-BY
Statistics 101: Point Estimators; Author: Brandon Foltz;https://www.youtube.com/watch?v=4v41z3HwLaM;License: Standard YouTube License, CC-BY
Central limit theorem; Author: 365 Data Science;https://www.youtube.com/watch?v=b5xQmk9veZ4;License: Standard YouTube License, CC-BY
Point Estimate Definition & Example; Author: Prof. Essa;https://www.youtube.com/watch?v=OTVwtvQmSn0;License: Standard Youtube License
Point Estimation; Author: Vamsidhar Ambatipudi;https://www.youtube.com/watch?v=flqhlM2bZWc;License: Standard Youtube License