
Concept explainers
Videos
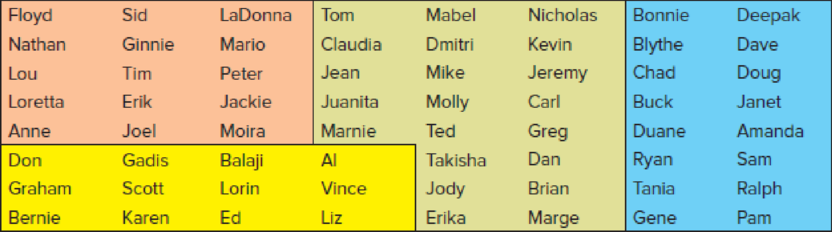
Below are 64 names of employees at NilCo. Colors denote different departments (finance, marketing, purchasing, engineering). Sample eight names from the display shown by using (a) simple random sampling, (b) systematic sampling, and (c) cluster sampling. Try to ensure that every name has an equal chance of being picked. Which sampling method seems most appropriate?
a.
Select 8 names from the given names, by using simple random sampling.
Answer to Problem 67CE
The 8 names obtained from the given names by using simple random sampling are:
| Name |
| Janet |
| Joel |
| Mario |
| Buck |
| Ralph |
| Gadis |
| Gene |
| Dmitri |
Explanation of Solution
Calculation:
Answers may vary. One of the possible answers is given below:
The data provides names of 64 employees at NilCo, employed in 4 departments- finance, marketing, purchasing and engineering. A separate color is used to represent each department.
It is not clearly specified which color represents which department. Thus, for convenience, name the pink-colored group as “Group 1”, the yellow-colored group as “Group 2”, the green-colored group as “Group 3” and the blue-colored group as “Group 4”,
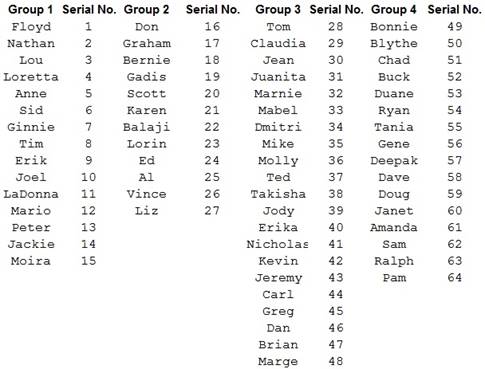
The list gives 64 unique names. Thus, assign serial numbers 1 to 64 to the names. Start by assigning the first name in Group 1 (Floyd) the number 1 and move column-wise till all 15 members of Group 1 are numbered from 1 to 15 (Moira).
Then, assign number 16 to the first name in Group 2 (Don) and continue column-wise till the last name in Group 2, Liz is numbered 27.
Now, give the next number 28 to the first member in Group 3 (Tom) and move column-wise till the last name in Group 3 (Marge) is numbered 48.
Lastly, number the first name in Group 4 (Bonnie) 49, move column-wise and finish with Pam, the last name in Group 4, assigning number 64.
Data arrangement:
EXCEL Procedure:
Step by step procedure to arrange the data by using EXCEL is given below:
- Enter the names in the first, second, third and fourth groups in columns A, C, E, G and name the columns Group 1, Group 2, Group 3, Group 4, respectively.
- Enter the assigned serial numbers of the names in the first, second, third and fourth groups in columns B, D, F, H respectively and name each column Serial No.
Output using EXCEL is given below:
Simple random sampling:
Simple random sampling is defined as a method of sampling in which, a sample of size n is drawn from a population of size N by using a random method, such as a random number table or software such as EXCEL, MINITAB, etc. to ensure that each of the N population units has the same probability of being selected in each draw. The simple random sampling gives a sample that is representative of the population.
EXCEL Procedure:
Step by step procedure to obtain a simple random sample by using EXCEL is given below:
- Give the name for column I as Simple Random Sampling in cell I1.
- Enter =RANDBETWEEN(1,64) in cells I2:I9 to obtain 8 random numbers lying between 1 and 64.
- Repeat the procedure till 8 unique random numbers are obtained.
Output using EXCEL is given below:
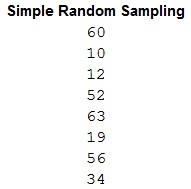
A careful observation of the first output with the arrangement of names and numbers shows that the names corresponding to the obtained random numbers are as follows:
| Random number | Name |
| 60 | Janet |
| 10 | Joel |
| 12 | Mario |
| 52 | Buck |
| 63 | Ralph |
| 19 | Gadis |
| 56 | Gene |
| 34 | Dmitri |
b.
Select 8 names from the given names, by using systematic sampling.
Answer to Problem 67CE
The 8 names obtained from the given names by using systematic sampling are:
| Name |
| Ginnie |
| Moira |
| Lorin |
| Juanita |
| Jody |
| Brian |
| Tania |
| Ralph |
Explanation of Solution
Calculation:
Answers may vary. One of the possible answers is given below:
Systematic sampling:
Systematic sampling is defined as a method of sampling in which, at first, an entity is chosen from the first k entities in the list, followed by choosing every kth entity thereafter, till the desired sample size is obtained. It is a random sampling method.
Here, the population size is N = 64 and the sample size is n = 8. Thus, the value of k is:
Thus, select one number randomly, between 1 and 8. Then select every 8th number, till a sample of 8 numbers is obtained.
EXCEL Procedure:
Step by step procedure to obtain a systematic sample by using EXCEL is given below:
- Give the name for column J as Systematic Sampling in cell J1.
- Enter =RANDBETWEEN(1,8) in cell J2 to obtain 1 random number lying between 1 and 8.
Output using EXCEL is given below:

The first number chosen is 7. Thereafter, successively add 8, till 8 numbers are obtained. Use the formula:
Thus, the 8 numbers and the corresponding names obtained from the given names by using systematic sampling are:
| Random number | Name |
| 7 | Ginnie |
| 15 | Moira |
| 23 | Lorin |
| 31 | Juanita |
| 39 | Jody |
| 47 | Brian |
| 55 | Tania |
| 63 | Ralph |
c.
Select 8 names from the given names, by using cluster sampling.
Identify the most appropriate sampling method in this situation.
Answer to Problem 67CE
The 8 names obtained from the given names by using cluster sampling are:
| Name |
| Brian |
| Jeremy |
| Marnie |
| Takisha |
| Dan |
| Mike |
| Molly |
| Erika |
Systematic sampling seems to be the most appropriate in this situation.
Explanation of Solution
Calculation:
Answers may vary. One of the possible answers is given below:
Cluster sampling:
Cluster sampling is defined as a method of sampling in which, at first, the entire population is divided into heterogeneous subgroups, especially by geographic areas called cluster, then desired number of clusters are selected from all the clusters, usually by simple random sampling. Each cluster is expected to be representative of the population.
Consider the 4 departments or groups as the 4 clusters.
In this case, sample size must be 8. However, all 4 clusters contain more than 8 names. Hence, use two-stage cluster sampling. In the first stage, randomly select one cluster out of the 4 clusters. In the second stage, randomly select 8 numbers from the cluster selected in Stage I.
First, randomly select 1 group out of the 4 groups.
EXCEL Procedure:
Step by step procedure to obtain a cluster by using EXCEL is given below:
- Give the name for column K as Cluster Sampling Stage I in cell K1.
- Enter =RANDBETWEEN(1,4) in cell K2 to obtain 1 random number lying between 1 and 4.
Output using EXCEL is given below:

Thus, the 3rd cluster, that is, Group 3 is selected.
Now, randomly select 8 numbers from Group 3. The individuals in Group 3 are numbered from 28 to 48. Hence, randomly select 8 numbers between 28 and 48.
EXCEL Procedure:
Step by step procedure to obtain a cluster sample by using EXCEL is given below:
- Give the name for column L as Cluster Sampling Stage II in cell L1.
- Enter =RANDBETWEEN(28,48) in cells L2:L9 to obtain 8 random numbers lying between 28 and 48.
- Repeat the procedure till 8 unique random numbers are obtained.
Output using EXCEL is given below:
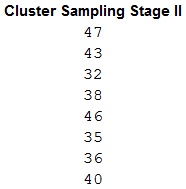
A careful observation of the first output with the arrangement of names and numbers shows that the names corresponding to the obtained random numbers are as follows:
| Random number | Name |
| 47 | Brian |
| 43 | Jeremy |
| 32 | Marnie |
| 38 | Takisha |
| 46 | Dan |
| 35 | Mike |
| 36 | Molly |
| 40 | Erika |
A careful observation of the 3 samples obtained in parts a, b and c shows that the cluster sampling selects individuals from only one group (Group 3), which definitely does not represent all the groups properly.
The simple random sampling selects individuals from all 4 groups, but does not ensure that the sample size from each group is proportional to the actual group size. Here, Group 3 is the largest group, but only 1 individual is selected from this group. This is the same as the number of individuals selected from the smallest group (1), Group 2.
The systematic sampling is the only sampling method here, which selects individuals over a properly spread out area. The number of members selected from each group using systematic sampling is also more-or-less in proportion to the actual group size.
Hence, systematic sampling seems to be the most appropriate in this situation.
Want to see more full solutions like this?
Chapter 2 Solutions
Applied Statistics in Business and Economics with Connect Access Card with LearnSmart


 Holt Mcdougal Larson Pre-algebra: Student Edition...AlgebraISBN:9780547587776Author:HOLT MCDOUGALPublisher:HOLT MCDOUGAL
 Glencoe Algebra 1, Student Edition, 9780079039897...AlgebraISBN:9780079039897Author:CarterPublisher:McGraw Hill
 College Algebra (MindTap Course List)AlgebraISBN:9781305652231Author:R. David Gustafson, Jeff HughesPublisher:Cengage Learning