
Videos
Criminal Justice: Prisoners The time plot in Figure 2-18 gives the number of state and federal prisoners per 100,000 population (Source: Statistical Abstract of the United States. 120th edition).
(a) Estimate the number of prisoners per 100.000 people for 1980 and for 1997. (b) Interpretation During the period shown. there was increased prosecution of drug offenses, longer sentences for common crimes, and reduced access to parole. What does the time-series graph say about the prison population change per 100,000 people?
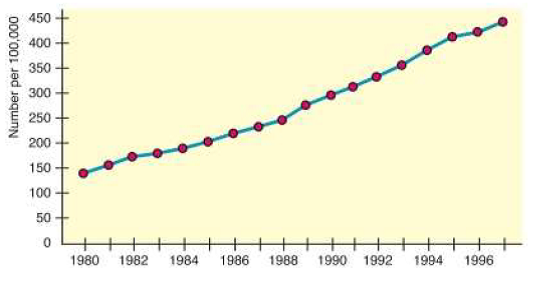
(c) In 1997, the U.S. population was approximately 266,574,000 people. At the rate of 444 prisoners per 100,000 population. about how many prisoners were in the system? The projected U.S. population for the year 2020 is

Trending nowThis is a popular solution!

Chapter 2 Solutions
UNDERSTANDING BASIC STAT LL BUND >A< F


- Population Genetics In the study of population genetics, an important measure of inbreeding is the proportion of homozygous genotypesthat is, instances in which the two alleles carried at a particular site on an individuals chromosomes are both the same. For population in which blood-related individual mate, them is a higher than expected frequency of homozygous individuals. Examples of such populations include endangered or rare species, selectively bred breeds, and isolated populations. in general. the frequency of homozygous children from mating of blood-related parents is greater than that for children from unrelated parents Measured over a large number of generations, the proportion of heterozygous genotypesthat is, nonhomozygous genotypeschanges by a constant factor 1 from generation to generation. The factor 1 is a number between 0 and 1. If 1=0.75, for example then the proportion of heterozygous individuals in the population decreases by 25 in each generation In this case, after 10 generations, the proportion of heterozygous individuals in the population decreases by 94.37, since 0.7510=0.0563, or 5.63. In other words, 94.37 of the population is homozygous. For specific types of matings, the proportion of heterozygous genotypes can be related to that of previous generations and is found from an equation. For mating between siblings 1 can be determined as the largest value of for which 2=12+14. This equation comes from carefully accounting for the genotypes for the present generation the 2 term in terms of those previous two generations represented by for the parents generation and by the constant term of the grandparents generation. a Find both solutions to the quadratic equation above and identify which is 1 use a horizontal span of 1 to 1 in this exercise and the following exercise. b After 5 generations, what proportion of the population will be homozygous? c After 20 generations, what proportion of the population will be homozygous?arrow_forwardcorporate triple-a bond interest rates for 12 consecutive months follow.9.5 9.3 9.4 9.6 9.8 9.7 9.8 10.5 9.9 9.7 9.6 9.6a. construct a time series plot. What type of pattern exists in the data?b. develop three-month and four-month moving averages for this time series. does thethree-month or four-month moving average provide more accurate forecasts basedon MSe? explain.c. What is the moving average forecast for the next month?arrow_forwardTime-Series Graphs. In Exercises 9 and 10, construct the time-series graph. Gender Pay Gap Listed below are women’s median earnings as a percentage of men’s median earnings for recent years beginning with 1990. Is there a trend? How does it appear to affect women?arrow_forward
 Functions and Change: A Modeling Approach to Coll...AlgebraISBN:9781337111348Author:Bruce Crauder, Benny Evans, Alan NoellPublisher:Cengage Learning
 Intermediate AlgebraAlgebraISBN:9781285195728Author:Jerome E. Kaufmann, Karen L. SchwittersPublisher:Cengage Learning